www.maipark.com Statistik Asuransi Gempa Bumi Indonesia 2009 [Indonesian Earthquake Insurance Statistic 2009] PT. Asuransi Maipark Indonesia

Welcome message from author
This document is posted to help you gain knowledge. Please leave a comment to let me know what you think about it! Share it to your friends and learn new things together.
Transcript
w w w . m a i p a r k . c o m
Statistik Asuransi Gempa
Bumi Indonesia 2009 [Indonesian Earthquake Insurance Statistic 2009]
PT. Asuransi Maipark Indonesia
i
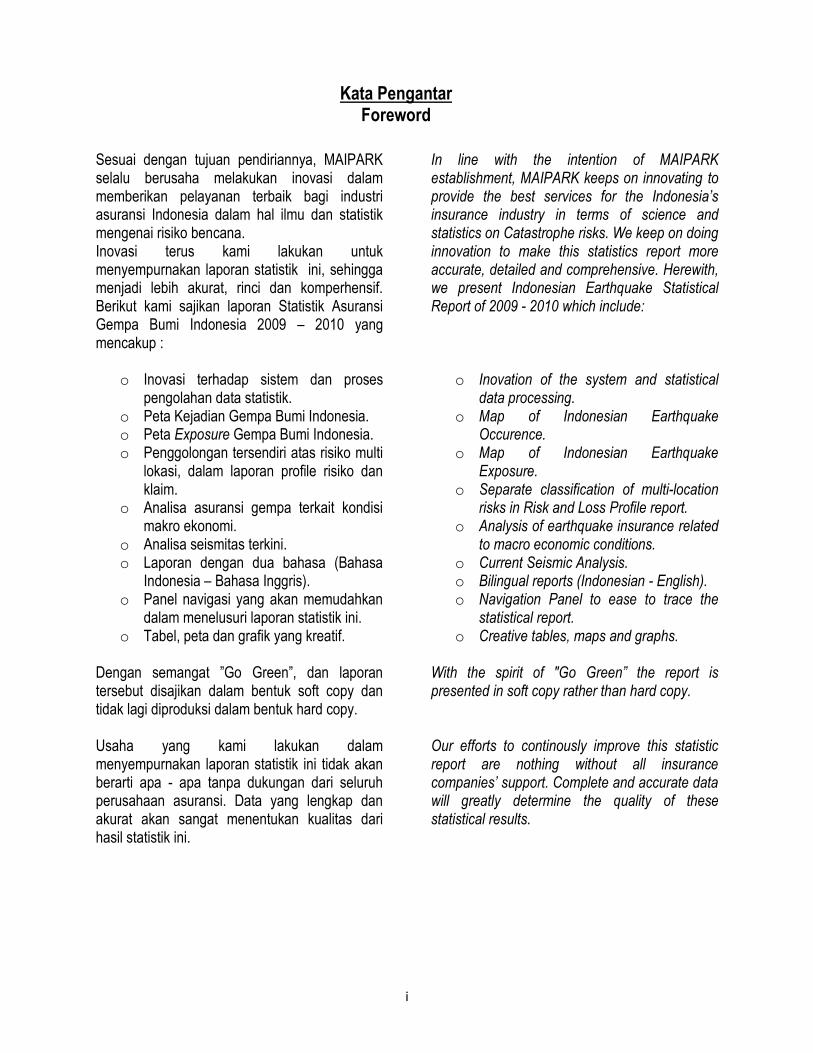
Sesuai dengan tujuan pendiriannya, MAIPARK selalu berusaha melakukan inovasi dalam memberikan pelayanan terbaik bagi industri asuransi Indonesia dalam hal ilmu dan statistik mengenai risiko bencana. Inovasi terus kami lakukan untuk menyempurnakan laporan statistik ini, sehingga menjadi lebih akurat, rinci dan komperhensif. Berikut kami sajikan laporan Statistik Asuransi Gempa Bumi Indonesia 2009 – 2010 yang mencakup :
o Inovasi terhadap sistem dan proses pengolahan data statistik.
o Peta Kejadian Gempa Bumi Indonesia. o Peta Exposure Gempa Bumi Indonesia. o Penggolongan tersendiri atas risiko multi
lokasi, dalam laporan profile risiko dan klaim.
o Analisa asuransi gempa terkait kondisi makro ekonomi.
o Analisa seismitas terkini. o Laporan dengan dua bahasa (Bahasa
Indonesia – Bahasa Inggris). o Panel navigasi yang akan memudahkan
dalam menelusuri laporan statistik ini. o Tabel, peta dan grafik yang kreatif.
Dengan semangat ”Go Green”, dan laporan tersebut disajikan dalam bentuk soft copy dan tidak lagi diproduksi dalam bentuk hard copy. Usaha yang kami lakukan dalam menyempurnakan laporan statistik ini tidak akan berarti apa - apa tanpa dukungan dari seluruh perusahaan asuransi. Data yang lengkap dan akurat akan sangat menentukan kualitas dari hasil statistik ini.
In line with the intention of MAIPARK establishment, MAIPARK keeps on innovating to provide the best services for the Indonesia’s insurance industry in terms of science and statistics on Catastrophe risks. We keep on doing innovation to make this statistics report more accurate, detailed and comprehensive. Herewith, we present Indonesian Earthquake Statistical Report of 2009 - 2010 which include:
o Inovation of the system and statistical data processing.
o Map of Indonesian Earthquake Occurence.
o Map of Indonesian Earthquake Exposure.
o Separate classification of multi-location risks in Risk and Loss Profile report.
o Analysis of earthquake insurance related to macro economic conditions.
o Current Seismic Analysis. o Bilingual reports (Indonesian - English). o Navigation Panel to ease to trace the
statistical report. o Creative tables, maps and graphs.
With the spirit of "Go Green” the report is presented in soft copy rather than hard copy. Our efforts to continously improve this statistic report are nothing without all insurance companies’ support. Complete and accurate data will greatly determine the quality of these statistical results.
Kata Pengantar Foreword
ii
Kami berharap laporan statistik ini dapat
memberikan manfaat tidak hanya bagi
perusahaan asuransi yang menangani asuransi
gempa bumi, namun juga berguna bagi industri
Asuransi Umum di Indonesia.
We hope that this statistic report is useful for both insurance companies having earthquake business and general insurance industry in Indonesia.
Salam Inovasi MAIPARK !!
Frans Sahusilawane President Director
iii
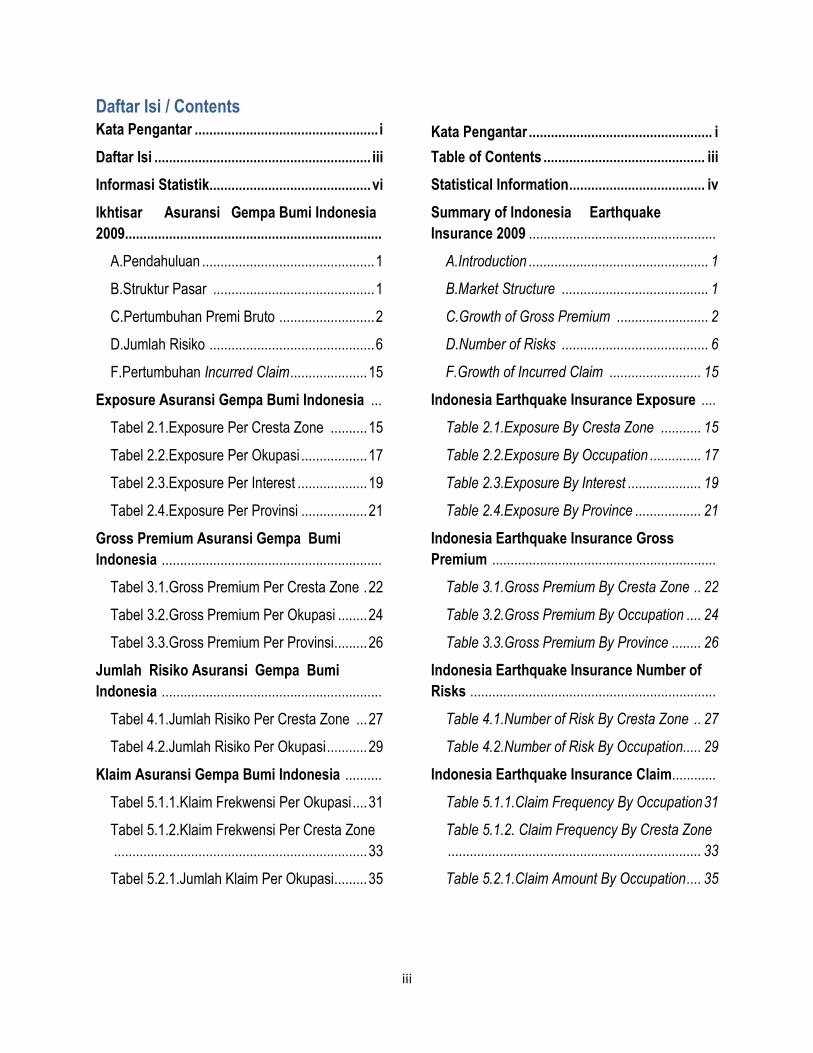
Daftar Isi / Contents
Kata Pengantar .................................................. i
Daftar Isi ........................................................... iii
Informasi Statistik............................................ vi
Ikhtisar Asuransi Gempa Bumi Indonesia
2009......................................................................
A.Pendahuluan ............................................... 1
B.Struktur Pasar ............................................ 1
C.Pertumbuhan Premi Bruto .......................... 2
D.Jumlah Risiko ............................................. 6
F.Pertumbuhan Incurred Claim ..................... 15
Exposure Asuransi Gempa Bumi Indonesia ...
Tabel 2.1.Exposure Per Cresta Zone .......... 15
Tabel 2.2.Exposure Per Okupasi .................. 17
Tabel 2.3.Exposure Per Interest ................... 19
Tabel 2.4.Exposure Per Provinsi .................. 21
Gross Premium Asuransi Gempa Bumi
Indonesia ............................................................
Tabel 3.1.Gross Premium Per Cresta Zone . 22
Tabel 3.2.Gross Premium Per Okupasi ........ 24
Tabel 3.3.Gross Premium Per Provinsi ......... 26
Jumlah Risiko Asuransi Gempa Bumi
Indonesia ............................................................
Tabel 4.1.Jumlah Risiko Per Cresta Zone ... 27
Tabel 4.2.Jumlah Risiko Per Okupasi ........... 29
Klaim Asuransi Gempa Bumi Indonesia ..........
Tabel 5.1.1.Klaim Frekwensi Per Okupasi .... 31
Tabel 5.1.2.Klaim Frekwensi Per Cresta Zone
..................................................................... 33
Tabel 5.2.1.Jumlah Klaim Per Okupasi ......... 35
Kata Pengantar .................................................. i
Table of Contents ............................................ iii
Statistical Information ..................................... iv
Summary of Indonesia Earthquake
Insurance 2009 ...................................................
A.Introduction ................................................. 1
B.Market Structure ........................................ 1
C.Growth of Gross Premium ......................... 2
D.Number of Risks ........................................ 6
F.Growth of Incurred Claim ......................... 15
Indonesia Earthquake Insurance Exposure ....
Table 2.1.Exposure By Cresta Zone ........... 15
Table 2.2.Exposure By Occupation .............. 17
Table 2.3.Exposure By Interest .................... 19
Table 2.4.Exposure By Province .................. 21
Indonesia Earthquake Insurance Gross
Premium .............................................................
Table 3.1.Gross Premium By Cresta Zone .. 22
Table 3.2.Gross Premium By Occupation .... 24
Table 3.3.Gross Premium By Province ........ 26
Indonesia Earthquake Insurance Number of
Risks ...................................................................
Table 4.1.Number of Risk By Cresta Zone .. 27
Table 4.2.Number of Risk By Occupation..... 29
Indonesia Earthquake Insurance Claim............
Table 5.1.1.Claim Frequency By Occupation 31
Table 5.1.2. Claim Frequency By Cresta Zone
..................................................................... 33
Table 5.2.1.Claim Amount By Occupation .... 35

iv
Tabel 5.2.2.Jumlah Klaim Per Cresta Zone .. 37
Profil Risiko dan Klaim ......................................
Tabel 6.1.Semua Tahun Underwriting, Semua
Okupasi, Semua Cresta Zone ...................... 39
Tabel 6.2. Tahun Underwriting 2009, Semua
Okupasi, Semua Cresta Zone ...................... 40
Tabel 6.3. Tahun Underwriting 2008, Semua
Okupasi, Semua Cresta Zone ...................... 41
Tabel 6.4. Tahun Underwriting 2007, Semua
Okupasi, Semua Cresta Zone ...................... 42
Tabel 6.5. Tahun Underwriting 2006, Semua
Okupasi, Semua Cresta Zone ...................... 43
Profil Risiko dan Klaim Tahun Underwriting
2009 .....................................................................
Okupasi Agricultural ..................................... 44
Okupasi Commercial .................................. 45
Okupasi Industrial ....................................... 46
Okupasi Residential .................................... 47
Profil Risiko dan Klaim Tahun Underwriting
2008 .....................................................................
Okupasi Agricultural .................................... 48
Okupasi Commercial .................................. 49
Okupasi Industrial ....................................... 50
Okupasi Residential .................................... 51
Profil Risiko dan Klaim Tahun Underwriting
2007 .....................................................................
Okupasi Agricultural .................................... 52
Okupasi Commercial .................................. 53
Okupasi Industrial ....................................... 54
Okupasi Residential .................................... 55
Profil Risiko dan Klaim Tahun Underwriting
2006 .....................................................................
Okupasi Agricultural .................................... 56
Table 5.2.2.Claim Amount By Cresta Zone .. 37
Risk and Loss Profile ........................................
Table 6.1.All Underwriting Year, All
Occupation, All Cresta Zone......................... 39
Table 6.2. Underwriting Year 2009, All
Occupation, All Cresta Zone......................... 40
Table 6.3. Underwriting Year 2008, All
Occupation, All Cresta Zone......................... 41
Table 6.4. Underwriting Year 2007, All
Occupation, All Cresta Zone......................... 42
Table 6.5. Underwriting Year 2006, All
Occupation, All Cresta Zone......................... 43
Risks and Loss Profile Underwriting Year
2009 ....................................................................
Agricultural Occupation ............................. 44
Commercial Occupation ............................ 45
Industrial Occupation ................................. 46
Residential Occupation ............................. 47
Risks and Loss Profile Underwriting Year
2008 ....................................................................
Agricultural Occupation ............................. 48
Commercial Occupation ............................ 49
Industrial Occupation ................................. 50
Residential Occupation ............................. 51
Risks and Loss Profile Underwriting Year
2007 ....................................................................
Agricultural Occupation ............................. 52
Commercial Occupation ............................ 53
Industrial Occupation ................................. 54
Residential Occupation .............................. 55
Risks and Loss Profile Underwriting Year
2006 ....................................................................
Agricultural Occupation ............................. 56
v
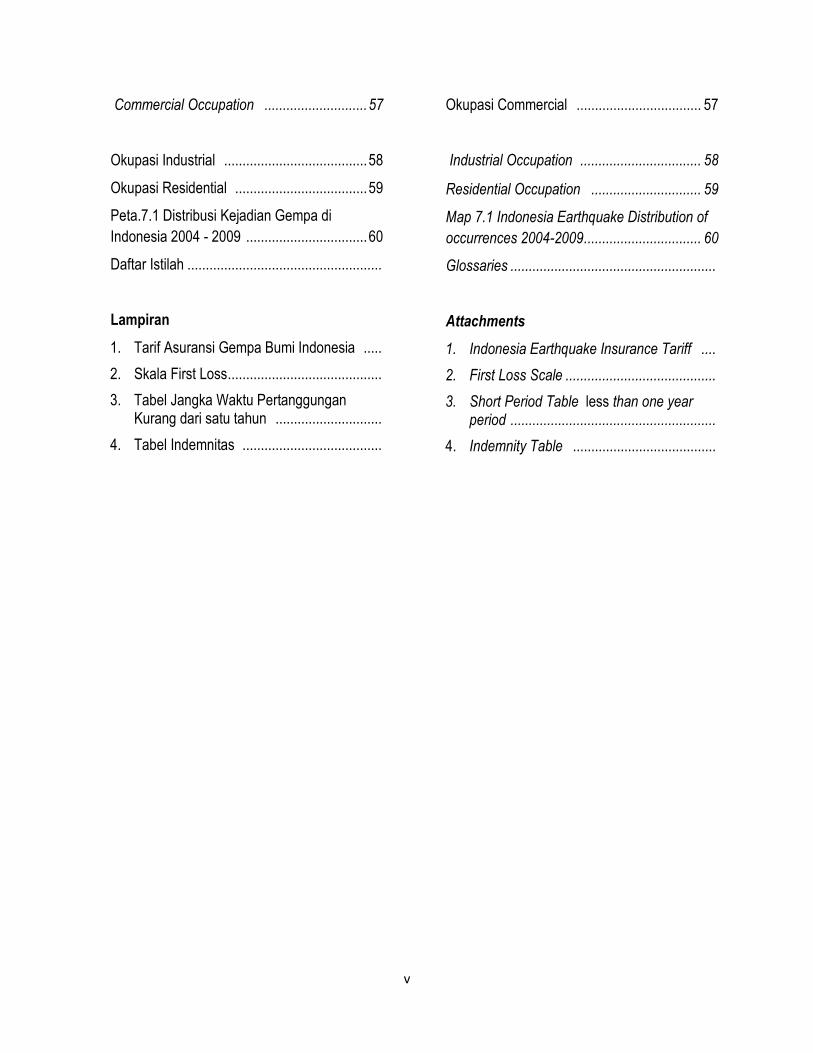
Commercial Occupation ............................ 57
Okupasi Industrial ....................................... 58
Okupasi Residential .................................... 59
Peta.7.1 Distribusi Kejadian Gempa di
Indonesia 2004 - 2009 ................................. 60
Daftar Istilah .....................................................
Lampiran
1. Tarif Asuransi Gempa Bumi Indonesia .....
2. Skala First Loss ..........................................
3. Tabel Jangka Waktu Pertanggungan Kurang dari satu tahun .............................
4. Tabel Indemnitas ......................................
Okupasi Commercial .................................. 57
Industrial Occupation ................................. 58
Residential Occupation .............................. 59
Map 7.1 Indonesia Earthquake Distribution of
occurrences 2004-2009 ................................ 60
Glossaries ........................................................
Attachments
1. Indonesia Earthquake Insurance Tariff ....
2. First Loss Scale .........................................
3. Short Period Table less than one year period ........................................................
4. Indemnity Table .......................................
vi
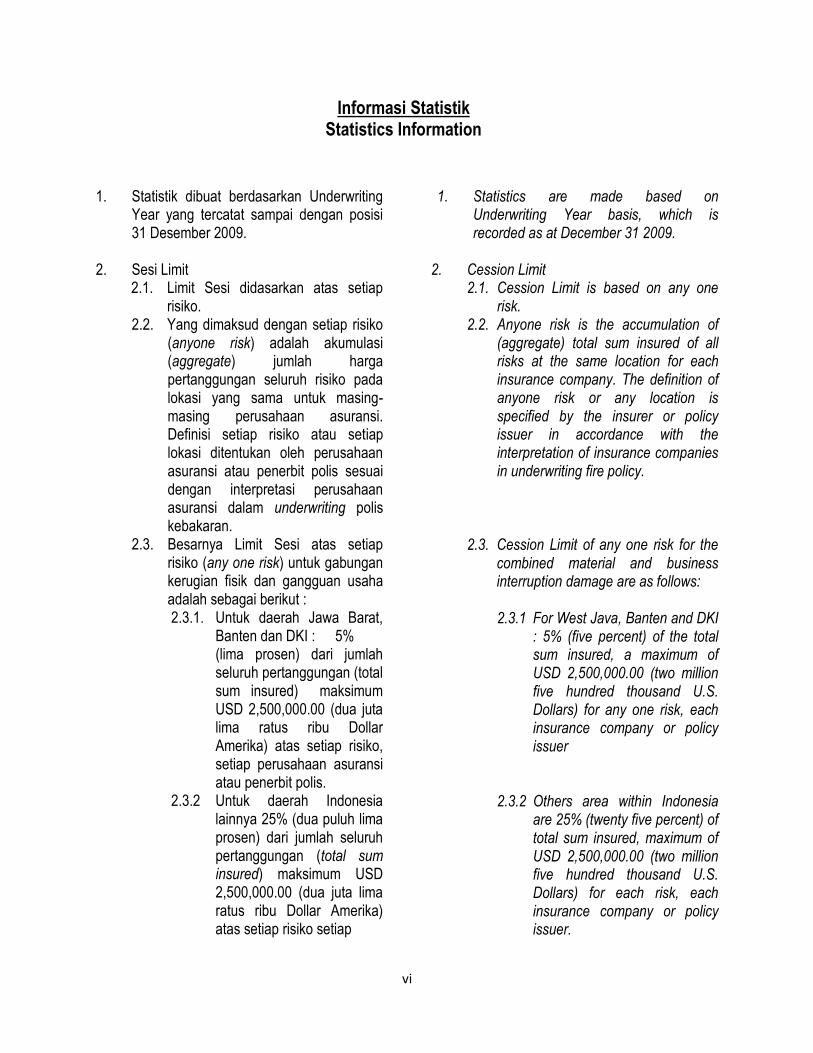
1. Statistik dibuat berdasarkan Underwriting
Year yang tercatat sampai dengan posisi 31 Desember 2009.
2. Sesi Limit 2.1. Limit Sesi didasarkan atas setiap
risiko. 2.2. Yang dimaksud dengan setiap risiko
(anyone risk) adalah akumulasi (aggregate) jumlah harga pertanggungan seluruh risiko pada lokasi yang sama untuk masing-masing perusahaan asuransi. Definisi setiap risiko atau setiap lokasi ditentukan oleh perusahaan asuransi atau penerbit polis sesuai dengan interpretasi perusahaan asuransi dalam underwriting polis kebakaran.
2.3. Besarnya Limit Sesi atas setiap risiko (any one risk) untuk gabungan kerugian fisik dan gangguan usaha adalah sebagai berikut : 2.3.1. Untuk daerah Jawa Barat,
Banten dan DKI : 5% (lima prosen) dari jumlah seluruh pertanggungan (total sum insured) maksimum USD 2,500,000.00 (dua juta lima ratus ribu Dollar Amerika) atas setiap risiko, setiap perusahaan asuransi atau penerbit polis.
2.3.2 Untuk daerah Indonesia lainnya 25% (dua puluh lima prosen) dari jumlah seluruh pertanggungan (total sum insured) maksimum USD 2,500,000.00 (dua juta lima ratus ribu Dollar Amerika) atas setiap risiko setiap
1. Statistics are made based on
Underwriting Year basis, which is recorded as at December 31 2009.
2. Cession Limit
2.1. Cession Limit is based on any one risk.
2.2. Anyone risk is the accumulation of (aggregate) total sum insured of all risks at the same location for each insurance company. The definition of anyone risk or any location is specified by the insurer or policy issuer in accordance with the interpretation of insurance companies in underwriting fire policy.
2.3. Cession Limit of any one risk for the combined material and business interruption damage are as follows: 2.3.1 For West Java, Banten and DKI
: 5% (five percent) of the total sum insured, a maximum of USD 2,500,000.00 (two million five hundred thousand U.S. Dollars) for any one risk, each insurance company or policy issuer
2.3.2 Others area within Indonesia are 25% (twenty five percent) of total sum insured, maximum of USD 2,500,000.00 (two million five hundred thousand U.S. Dollars) for each risk, each insurance company or policy issuer.
Informasi Statistik Statistics Information
vii
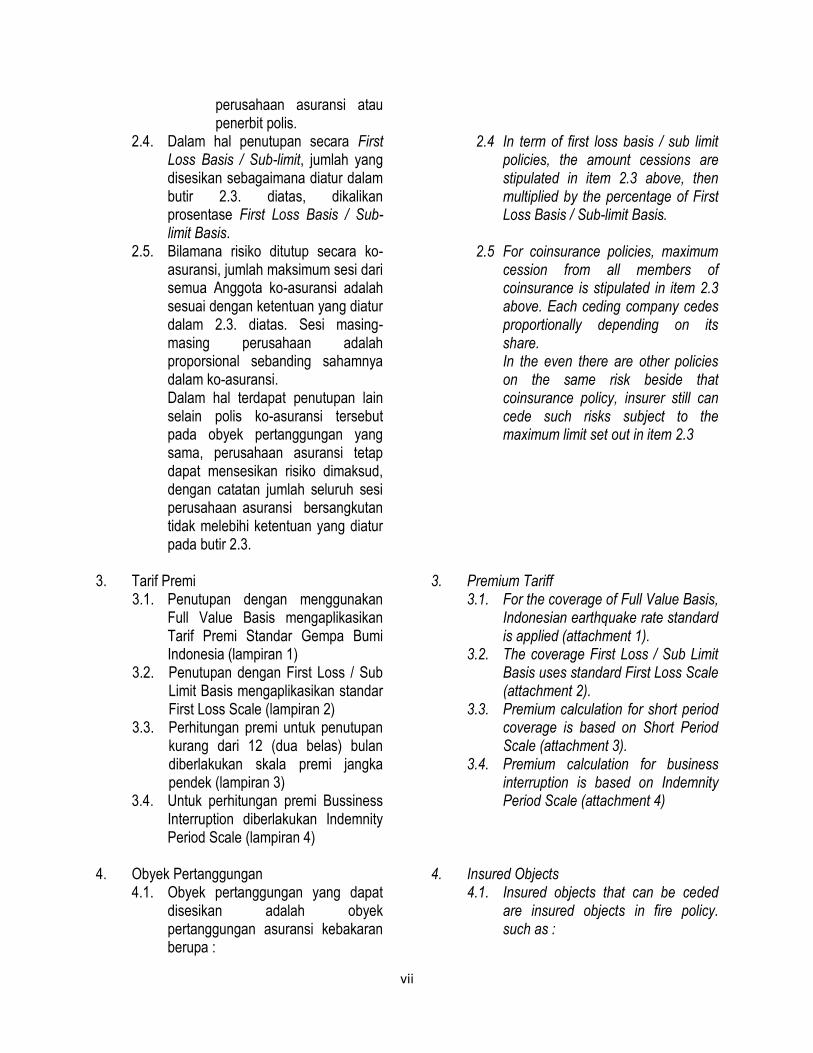
perusahaan asuransi atau penerbit polis.
2.4. Dalam hal penutupan secara First Loss Basis / Sub-limit, jumlah yang disesikan sebagaimana diatur dalam butir 2.3. diatas, dikalikan prosentase First Loss Basis / Sub-limit Basis.
2.5. Bilamana risiko ditutup secara ko-asuransi, jumlah maksimum sesi dari semua Anggota ko-asuransi adalah sesuai dengan ketentuan yang diatur dalam 2.3. diatas. Sesi masing-masing perusahaan adalah proporsional sebanding sahamnya dalam ko-asuransi.
Dalam hal terdapat penutupan lain selain polis ko-asuransi tersebut pada obyek pertanggungan yang sama, perusahaan asuransi tetap dapat mensesikan risiko dimaksud, dengan catatan jumlah seluruh sesi perusahaan asuransi bersangkutan tidak melebihi ketentuan yang diatur pada butir 2.3.
3. Tarif Premi
3.1. Penutupan dengan menggunakan Full Value Basis mengaplikasikan Tarif Premi Standar Gempa Bumi Indonesia (lampiran 1)
3.2. Penutupan dengan First Loss / Sub Limit Basis mengaplikasikan standar First Loss Scale (lampiran 2)
3.3. Perhitungan premi untuk penutupan kurang dari 12 (dua belas) bulan diberlakukan skala premi jangka pendek (lampiran 3)
3.4. Untuk perhitungan premi Bussiness Interruption diberlakukan Indemnity Period Scale (lampiran 4)
4. Obyek Pertanggungan
4.1. Obyek pertanggungan yang dapat disesikan adalah obyek pertanggungan asuransi kebakaran berupa :
2.4 In term of first loss basis / sub limit policies, the amount cessions are stipulated in item 2.3 above, then multiplied by the percentage of First Loss Basis / Sub-limit Basis.
2.5 For coinsurance policies, maximum
cession from all members of coinsurance is stipulated in item 2.3 above. Each ceding company cedes proportionally depending on its share. In the even there are other policies on the same risk beside that coinsurance policy, insurer still can cede such risks subject to the maximum limit set out in item 2.3
3. Premium Tariff
3.1. For the coverage of Full Value Basis, Indonesian earthquake rate standard is applied (attachment 1).
3.2. The coverage First Loss / Sub Limit Basis uses standard First Loss Scale (attachment 2).
3.3. Premium calculation for short period coverage is based on Short Period Scale (attachment 3).
3.4. Premium calculation for business interruption is based on Indemnity Period Scale (attachment 4)
4. Insured Objects 4.1. Insured objects that can be ceded
are insured objects in fire policy. such as :
viii
4.1.1. Kerusakan Fisik : Bangunan Pondasi Penggalian dan Sejenisnya Persediaan Barang Lain-lain
4.1.2 Gangguan Usaha : Keuntungan Bruto Upah Kenaikan Biaya
Operasional Lain-lain
4.2 Penutupan sebagaimana dimaksud pada butir 4.1. adalah yang ditutup secara langsung (direct business) termasuk ko-asuransi. Penutupan tidak langsung (indirect business/Reasuransi) tidak dapat disesikan.
5. Pelaporan Bordero. Pelaporan bordero dilakukan setiap
bulannya untuk semua risiko yang ditutup pada bulan yang bersangkutan dan sudah harus diterima selambat-lambatnya pada akhir bulan berikutnya.
6. Untuk kasus “Multi Location Risk” yang
mengalami kesulitan dalam memberikan detail harga pertanggungan perlokasi maka dengan persetujuan AAUI pensesian risiko dan perhitungan premi dilakukan pada zona-zona tertentu.
7. Untuk menggambarkan premi dan harga
pertanggungan yang sebenarnya dalam penutupan asuransi gempa bumi berdasarkan ko-asuransi, diharapkan agar seluruh anggota ko-asuransi mensesikan risiko gempa bumi tersebut.
4.1.1. Material damage :
Buildings
Foundations
Excavation and the like
Stocks
Others
4.1.2. Business Interruption
Gross Profit
Wages
Increase in cost of working
Others
4.2. Insured objects referred in item 4.1 are objects from direct business insurance, including coinsurance. Indirect businesses cannot be ceded.
5. Bordereaux Report. Bordereaux reports is submitted on a monthly basis for all risk underwritten in the month concerned and should be received by the end of the following month.
6. In the case of Multi Location Risks with no details of sum insured provided per location, the risk cession and its premium calculation specified zones after approved by AAUI.
7. In order to get overall pictures of each earthquake insurance covers, it is strongly hoped that all coinsurance members could cede the earthquake cession.

S t a t i s t i k A s u r a n s i G e m p a B u m i I n d o n e s i a 2 0 0 9 1 | P a g e
A. Pendahuluan. Tingkat Pendapatan Domestik Bruto (PDB) Indonesia di tahun 2009 ini tercatat sebesar Rp. 5.613,40. Hal ini menunjukan telah terjadi peningkatan sebesar 13,31% dibanding Pendapatan Domestik Bruto di tahun 2008 yang sebesar Rp. 4.954,26 triliun. Kenaikan Pendapatan Domestik Bruto ditahun ini lebih rendah jika dibanding dengan kenaikan pada tahun 2008 yang mencapai 25,19% Tingkat Pendapatan Domestik Bruto (PDB) Indonesia dalam lima tahun terakhir dapat dilihat pada grafik 1.1 dibawah ini B. Struktur Pasar. Per 31 Desember 2009, seperti yang dilaporkan oleh Bapepam LK – Departemen Keuangan dalam laporan Indonesian Insurance Directory 2009, jumlah perusahaan asuransi dan reasuransi umum di Indonesia adalah 93 perusahaan. Dengan rincian 89 perusahaan asuransi umum dan 4 perusahaan reasuransi umum. Dari ke 89 perusahan asuransi umum ini,
A. Introduction The Gross Domestic Product (GDP) of Indonesia in the year 2009 is reported in amount of Rp. 5.613,40 trillion. It increases for about 13,31% from Rp. 4.954,26 trillion of the Gross Domestic Product (GDP) in 2008. However this increase is still lower compared to the increased of 25,19% in 2008. The level of Gross Domestic Product of Indonesia for the last five years is shown in graph 1.1 below. B. Market Structure. On 31 December 2009, as reported by Bapepam LK- Ministry of Finance, in the report Based on the report of Indonesia Insurance Directory, the member of general insurance and reinsurance in Indonesia is 93 companies, comprising of 89 general insurance companies and 4 reinsurance companies. Out of these 89 general insurance companies
Pendapatan Domestik Bruto (PDB) Gross Domestik Product (GDP)
Grafik 1.1 / Graph 1.1
Ikhtisar Kegiatan Usaha Asuransi Gempa Bumi Indonesia Tahun 2009 Summary of Indonesian Earthquake Insurance Business Activities in 2009
Dalam Miliar Rupiah In Billion Rupiah

S t a t i s t i k A s u r a n s i G e m p a B u m i I n d o n e s i a 2 0 0 9 2 | P a g e
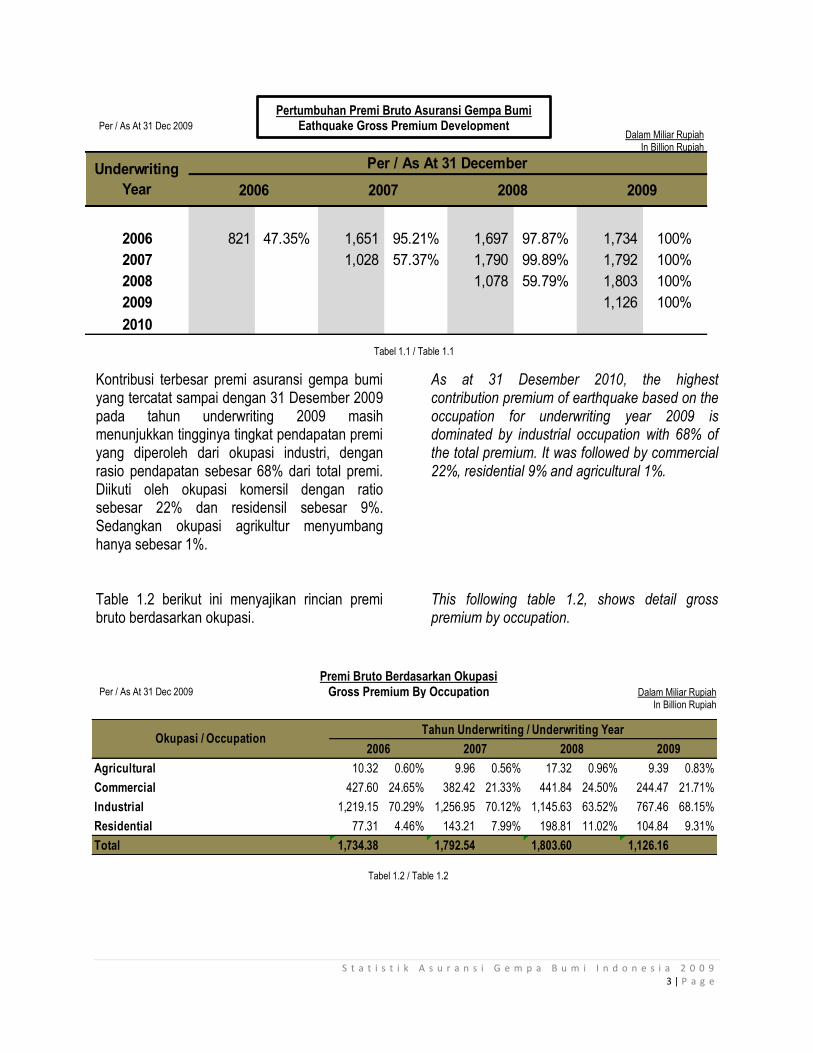
20 diantaranya adalah perusahaan patungan. Sedangkan 69 sisanya adalah perusahan swasta nasional. Dari 4 perusahaan reasuransi umum, kesemuanya adalah perusahaan swasta nasional. C. Pertumbuhan Premi Bruto Sampai dengan posisi per 31 Desember 2009, pendapatan premi bruto asuransi gempa bumi terlihat menunjukan pertumbuhan yang positif. Hal ini terlihat pada pendapatan premi underwriting 2009 ditahun pertama yang sebesar Rp. 1.126 milliar. Angka ini lebih besar 4,45% dibandingkan dengan premi underwriting 2008 ditahun pertamanya yg sebesar Rp. 1.078 milliar. Pendapatan premi bruto asuransi gempa bumi per 31 Desember 2009 untuk tahun underwriting 2006 adalah sebesar Rp. 1.734 Milliar. Premi Bruto untuk tahun underwriting 2007 tercatat sebesar Rp. 1.792 Milliar, sedangkan tahun underwriting 2008 adalah Rp. 1.803 milliar. Tabel 1.1 dan grafik 1.2 berikut ini menggambarkan pertumbuhan premi bruto dari tahun ke tahun.
20 general insurance companies are joint venture and the remaining is private national companies. 4 reinsurance companies are private national companies. C. Gross Premium Growth As per 31 December 2009, the gross premium of earthquake insurance shows positive growth. We could see this from the premium of underwriting year 2009 in the first year development, which is Rp. 1.126 billion. This is 4,45% higher than the premium of underwriting year 2008 in the first year of its development, which is Rp. 1.078. The gross premium of earthquake per 31 December 2009 for underwriting year 2006, 2007, 2008 are Rp. 1.734 billion, Rp. 1.792 billion, Rp. 1.803 billion respectively. Table 1.1 and graph 1.2 below show gross premium development from year to year.
Grafik 1.2 / Graph 1.2
Pertumbuhan Premi Bruto Asuransi Gempa Bumi Eathquake Gross Premium Development
As at 31 December 2006 2007 2008 2009
S t a t i s t i k A s u r a n s i G e m p a B u m i I n d o n e s i a 2 0 0 9 3 | P a g e
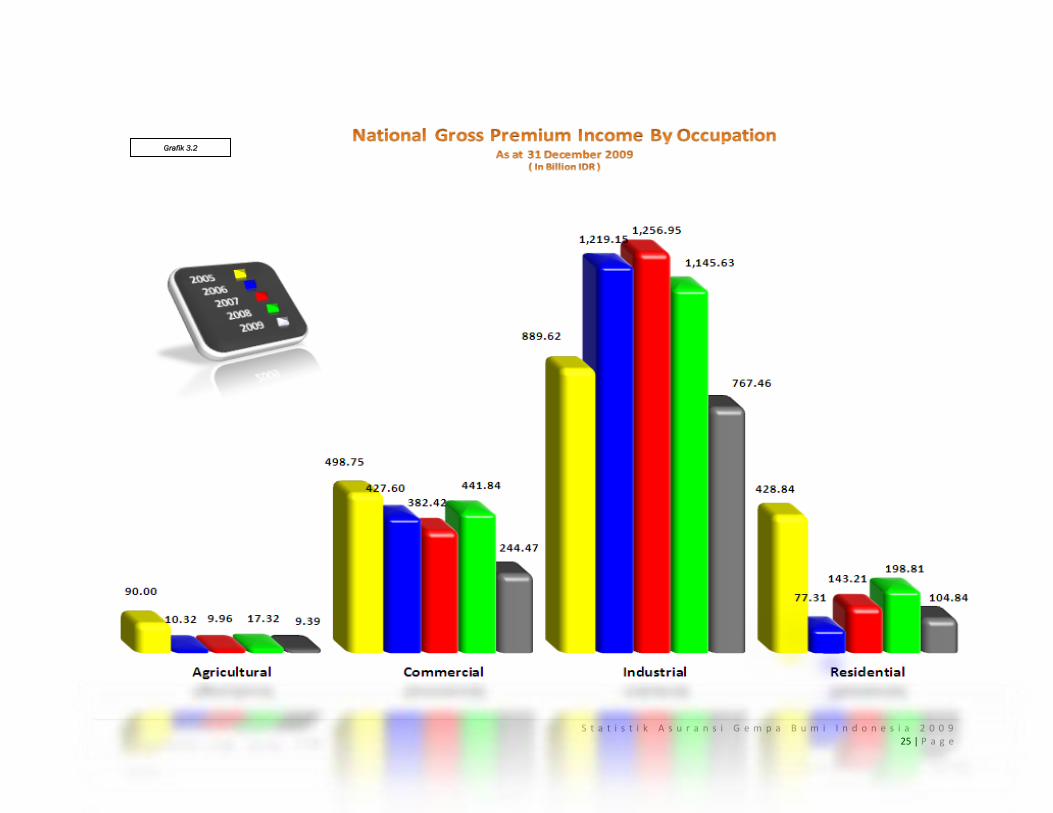
Kontribusi terbesar premi asuransi gempa bumi yang tercatat sampai dengan 31 Desember 2009 pada tahun underwriting 2009 masih menunjukkan tingginya tingkat pendapatan premi yang diperoleh dari okupasi industri, dengan rasio pendapatan sebesar 68% dari total premi. Diikuti oleh okupasi komersil dengan ratio sebesar 22% dan residensil sebesar 9%. Sedangkan okupasi agrikultur menyumbang hanya sebesar 1%. Table 1.2 berikut ini menyajikan rincian premi bruto berdasarkan okupasi.
As at 31 Desember 2010, the highest contribution premium of earthquake based on the occupation for underwriting year 2009 is dominated by industrial occupation with 68% of the total premium. It was followed by commercial 22%, residential 9% and agricultural 1%. This following table 1.2, shows detail gross premium by occupation.
Premi Bruto Berdasarkan Okupasi Gross Premium By Occupation
Tabel 1.2 / Table 1.2
Per / As At 31 Dec 2009
2006 821 47.35% 1,651 95.21% 1,697 97.87% 1,734 100%
2007 1,028 57.37% 1,790 99.89% 1,792 100%
2008 1,078 59.79% 1,803 100%
2009 1,126 100%
2010
20072006
Underwriting
Year
Per / As At 31 December
2008 2009
Tabel 1.1 / Table 1.1
Dalam Miliar Rupiah In Billion Rupiah
Pertumbuhan Premi Bruto Asuransi Gempa Bumi Eathquake Gross Premium Development Per / As At 31 Dec 2009
Dalam Miliar Rupiah In Billion Rupiah
Dalam Miliar Rupiah In Billion Rupiah
Agricultural 10.32 0.60% 9.96 0.56% 17.32 0.96% 9.39 0.83%
Commercial 427.60 24.65% 382.42 21.33% 441.84 24.50% 244.47 21.71%
Industrial 1,219.15 70.29% 1,256.95 70.12% 1,145.63 63.52% 767.46 68.15%
Residential 77.31 4.46% 143.21 7.99% 198.81 11.02% 104.84 9.31%
Total 1,734.38 1,792.54 1,803.60 1,126.16
Okupasi / Occupation2009200820072006
Tahun Underwriting / Underwriting Year
S t a t i s t i k A s u r a n s i G e m p a B u m i I n d o n e s i a 2 0 0 9 4 | P a g e
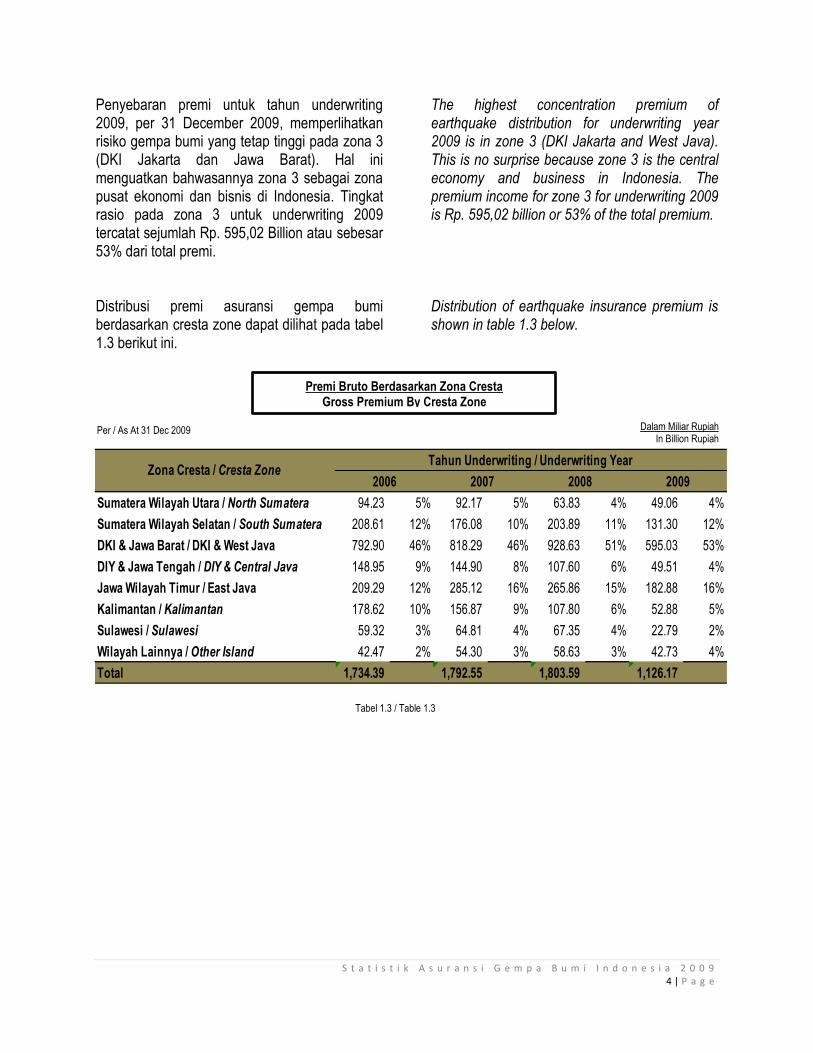
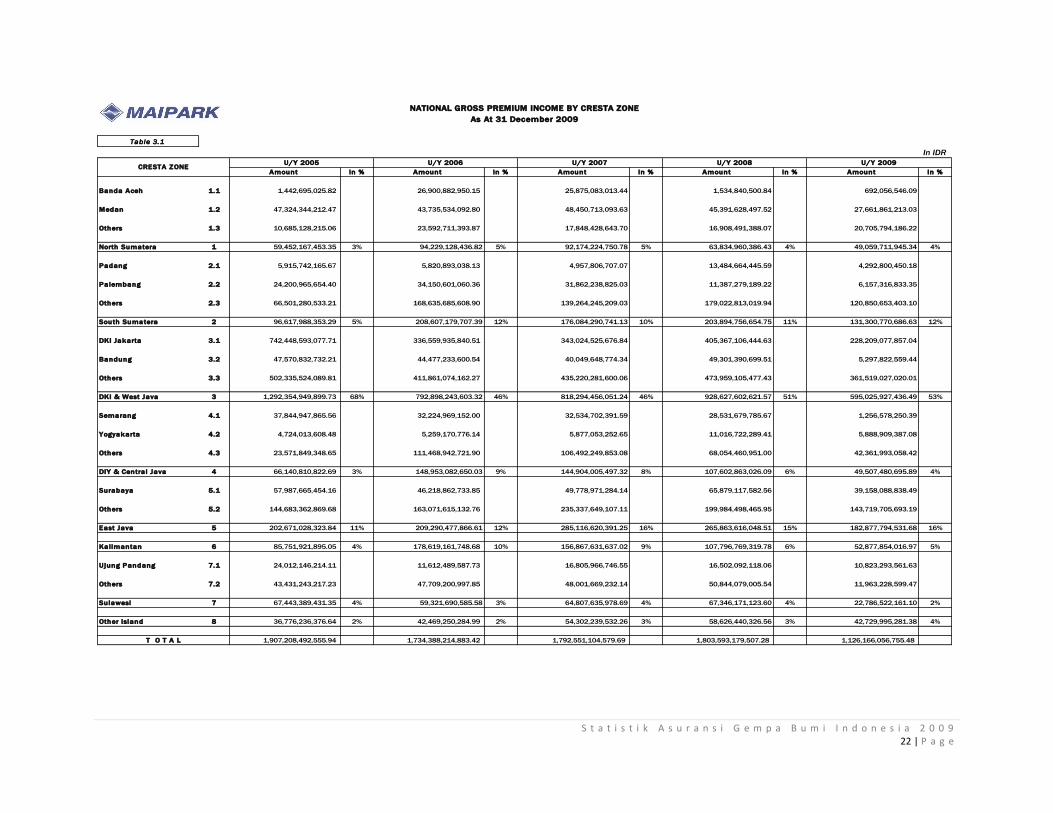
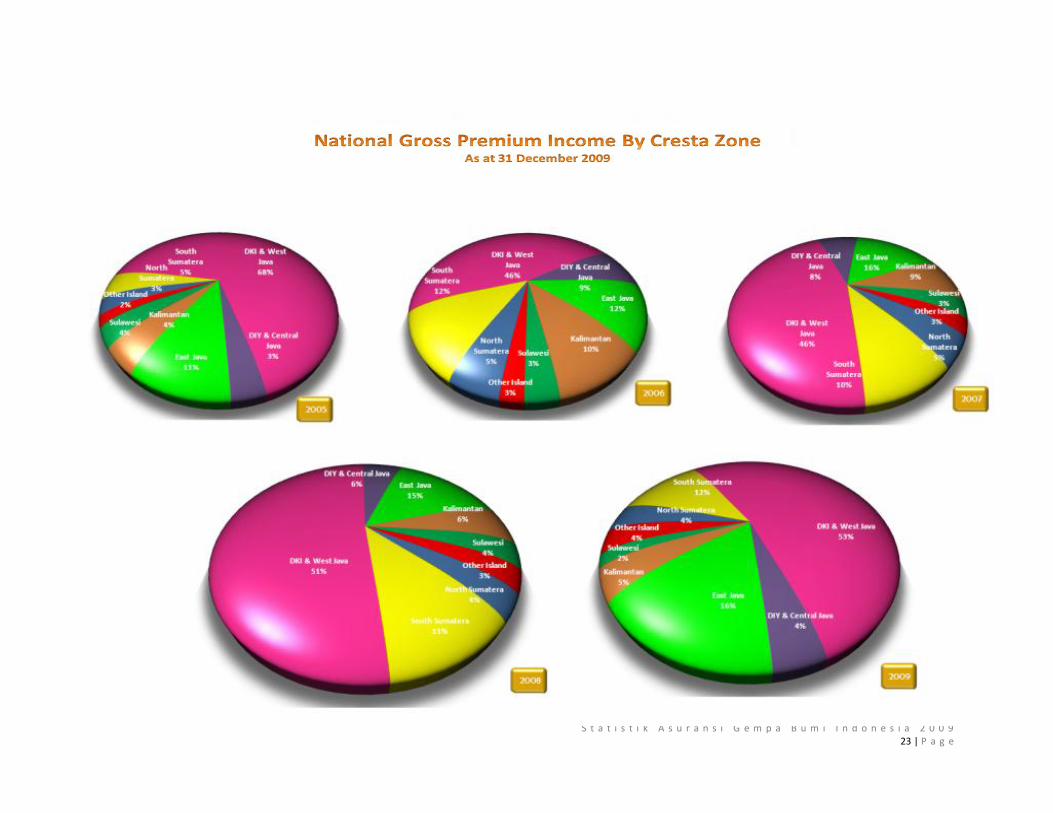
Penyebaran premi untuk tahun underwriting 2009, per 31 December 2009, memperlihatkan risiko gempa bumi yang tetap tinggi pada zona 3 (DKI Jakarta dan Jawa Barat). Hal ini menguatkan bahwasannya zona 3 sebagai zona pusat ekonomi dan bisnis di Indonesia. Tingkat rasio pada zona 3 untuk underwriting 2009 tercatat sejumlah Rp. 595,02 Billion atau sebesar 53% dari total premi. Distribusi premi asuransi gempa bumi berdasarkan cresta zone dapat dilihat pada tabel 1.3 berikut ini.
The highest concentration premium of earthquake distribution for underwriting year 2009 is in zone 3 (DKI Jakarta and West Java). This is no surprise because zone 3 is the central economy and business in Indonesia. The premium income for zone 3 for underwriting 2009 is Rp. 595,02 billion or 53% of the total premium. Distribution of earthquake insurance premium is shown in table 1.3 below.
Dalam Miliar Rupiah In Billion Rupiah
Sumatera Wilayah Utara / North Sumatera 94.23 5% 92.17 5% 63.83 4% 49.06 4%
Sumatera Wilayah Selatan / South Sumatera 208.61 12% 176.08 10% 203.89 11% 131.30 12%
DKI & Jawa Barat / DKI & West Java 792.90 46% 818.29 46% 928.63 51% 595.03 53%
DIY & Jawa Tengah / DIY & Central Java 148.95 9% 144.90 8% 107.60 6% 49.51 4%
Jawa Wilayah Timur / East Java 209.29 12% 285.12 16% 265.86 15% 182.88 16%
Kalimantan / Kalimantan 178.62 10% 156.87 9% 107.80 6% 52.88 5%
Sulawesi / Sulawesi 59.32 3% 64.81 4% 67.35 4% 22.79 2%
Wilayah Lainnya / Other Island 42.47 2% 54.30 3% 58.63 3% 42.73 4%
Total 1,734.39 1,792.55 1,803.59 1,126.17
Zona Cresta / Cresta Zone2009200820072006
Tahun Underwriting / Underwriting Year
Premi Bruto Berdasarkan Zona Cresta Gross Premium By Cresta Zone
Per / As At 31 Dec 2009
Tabel 1.3 / Table 1.3

S t a t i s t i k A s u r a n s i G e m p a B u m i I n d o n e s i a 2 0 0 9 5 | P a g e
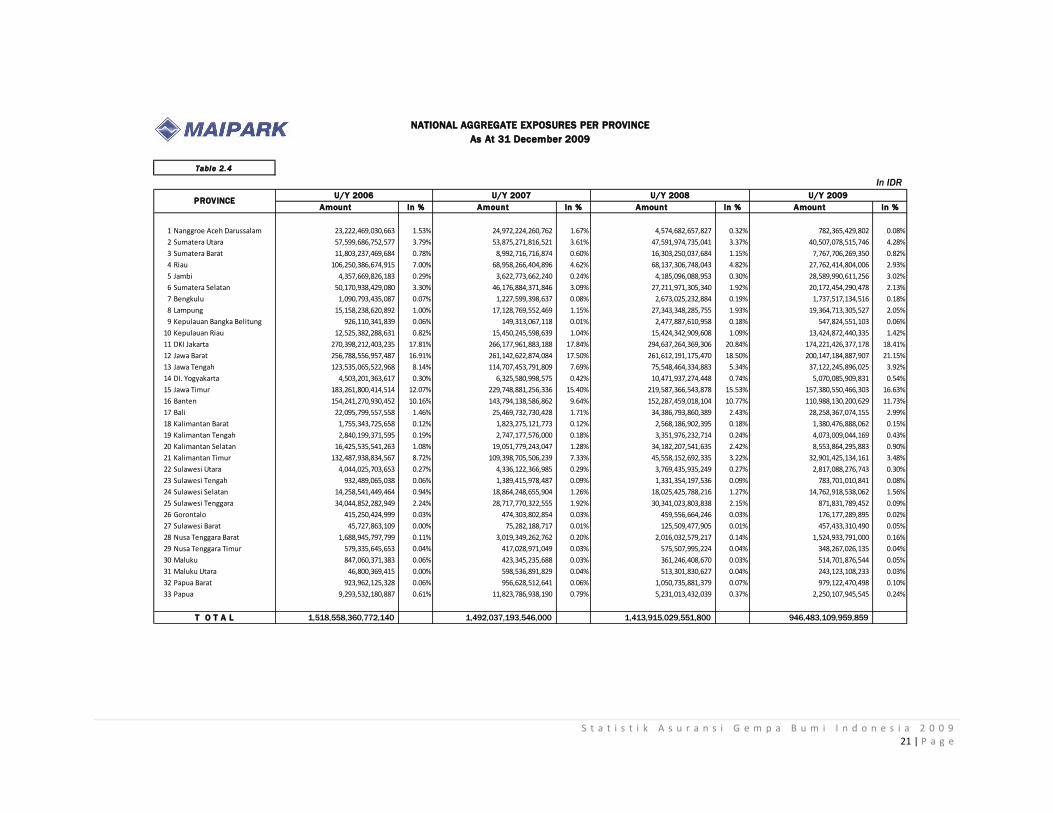
Tabel 1.4 dibawah ini menyajikan kontribusi pendapatan premi asuransi gempa bumi yang dibagi berdasarkan provinsi, catatan per tanggal 31 Desember 2009.
This following table 1.4 shows earthquake insurance premium contribution by province, as at 31 December 2009.
2006 % 2007 % 2008 % 2009 %
1 Nanggroe Aceh Darussalam 27,649.79 0.02 28,658.84 0.02 6,018.12 0.00 986.29 0.00
2 Sumatera Utara 66,579.34 0.04 63,515.38 0.04 57,816.84 0.03 48,073.42 0.04
3 Sumatera Barat 13,037.52 0.01 10,297.59 0.01 19,691.03 0.01 9,738.21 0.01
4 Riau 106,350.29 0.06 72,634.43 0.04 90,968.88 0.05 28,855.06 0.03
5 Jambi 4,451.78 0.00 4,027.19 0.00 4,707.99 0.00 30,704.83 0.03
6 Sumatera Selatan 55,018.46 0.03 51,297.16 0.03 32,399.78 0.02 23,543.85 0.02
7 Bengkulu 1,245.13 0.00 1,598.24 0.00 3,390.81 0.00 2,580.54 0.00
8 Lampung 15,990.52 0.01 19,843.54 0.01 32,203.33 0.02 22,018.53 0.02
9 Kepulauan Bangka Belitung 678.06 0.00 154.01 0.00 3,337.05 0.00 582.87 0.00
10 Kepulauan Riau 11,835.41 0.01 16,232.12 0.01 17,195.89 0.01 13,276.88 0.01
11 DKI Jakarta 336,559.94 0.19 343,024.53 0.19 405,367.11 0.22 228,209.08 0.20
12 Jawa Barat 285,977.24 0.16 306,473.96 0.17 333,158.73 0.18 234,771.25 0.21
13 Jawa Tengah 143,295.05 0.08 138,512.45 0.08 95,235.54 0.05 43,241.85 0.04
14 DI. Yogyakarta 5,658.03 0.00 6,391.56 0.00 12,367.32 0.01 6,265.63 0.01
15 Jawa Timur 209,290.48 0.12 285,116.62 0.16 265,863.62 0.15 182,877.79 0.16
16 Banten 170,361.07 0.10 168,795.97 0.09 190,101.77 0.11 132,045.60 0.12
17 Bali 25,744.91 0.01 32,221.43 0.02 46,535.15 0.03 35,567.04 0.03
18 Kalimantan Barat 1,659.35 0.00 1,765.28 0.00 2,914.00 0.00 1,475.26 0.00
19 Kalimantan Tengah 2,779.65 0.00 2,714.05 0.00 3,576.88 0.00 4,466.40 0.00
20 Kalimantan Selatan 19,156.03 0.01 22,533.05 0.01 45,667.09 0.03 9,924.12 0.01
21 Kalimantan Timur 155,024.13 0.09 129,855.25 0.07 55,638.79 0.03 37,012.08 0.03
22 Sulawesi Utara 4,173.70 0.00 5,111.50 0.00 4,774.35 0.00 3,383.33 0.00
23 Sulawesi Tengah 1,006.67 0.00 1,551.16 0.00 1,649.39 0.00 930.49 0.00
24 Sulawesi Selatan 16,717.73 0.01 23,069.68 0.01 23,920.42 0.01 17,210.68 0.02
25 Sulawesi Tenggara 36,900.42 0.02 34,438.72 0.02 36,343.14 0.02 551.64 0.00
26 Gorontalo 470.11 0.00 558.02 0.00 545.61 0.00 187.73 0.00
27 Sulawesi Barat 53.06 0.00 78.55 0.00 113.26 0.00 522.65 0.00
28 Nusa Tenggara Barat 1,963.32 0.00 3,706.01 0.00 2,771.45 0.00 1,764.71 0.00
29 Nusa Tenggara Timur 660.94 0.00 470.79 0.00 674.42 0.00 402.12 0.00
30 Maluku 986.22 0.00 528.84 0.00 456.61 0.00 656.16 0.00
31 Maluku Utara 51.22 0.00 703.64 0.00 687.02 0.00 319.11 0.00
32 Papua Barat 1,039.50 0.00 1,151.93 0.00 1,263.10 0.00 1,182.48 0.00
33 Papua 12,023.13 0.01 15,519.60 0.01 6,238.68 0.00 2,838.38 0.00 1,734,388.21 1,792,551.10 1,803,593.18 1,126,166.06
Provinsi / Province
Premi Bruto As. Gempa Bumi
Earthquake Insurance Gross Premium
*) As at 31 Dec 2010
Premi Bruto Asuransi Gempa Bumi Berdasarkan Provinsi Earthquake Gross Premium By Province
Tabel 1.4 / Table 1.4
Dalam Jutaan Rupiah In Million Rupiah
Per / As At 31 Dec 2009
S t a t i s t i k A s u r a n s i G e m p a B u m i I n d o n e s i a 2 0 0 9 6 | P a g e
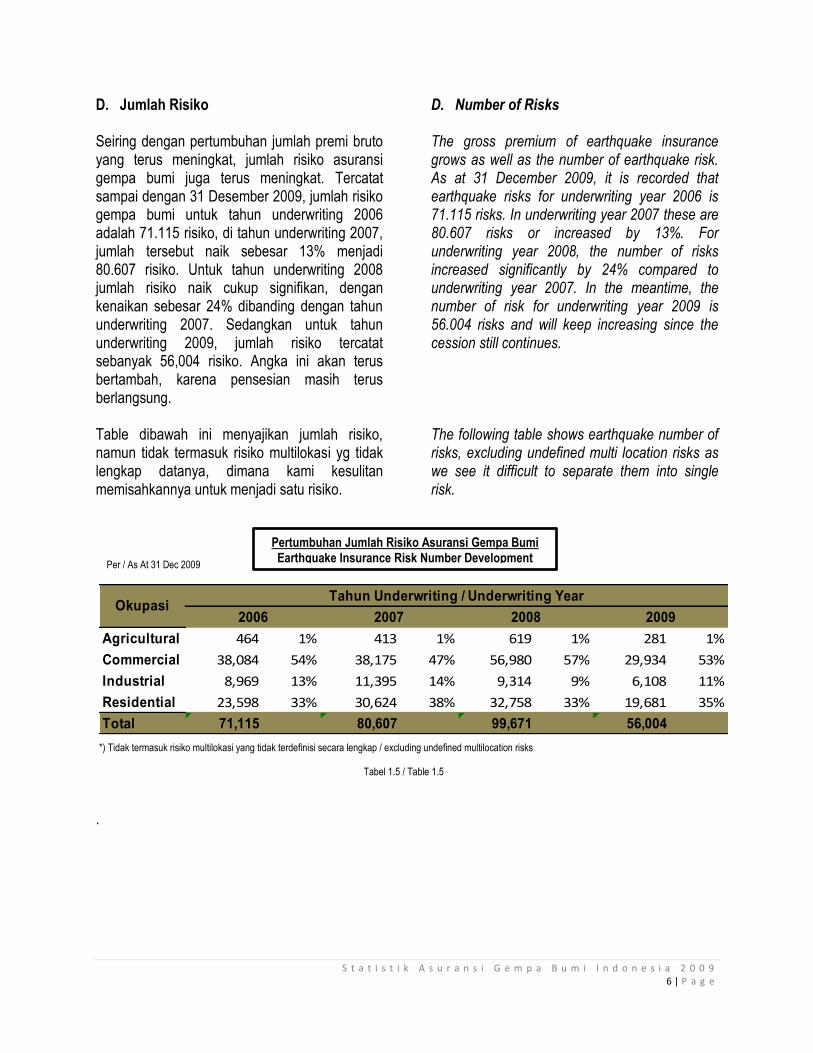
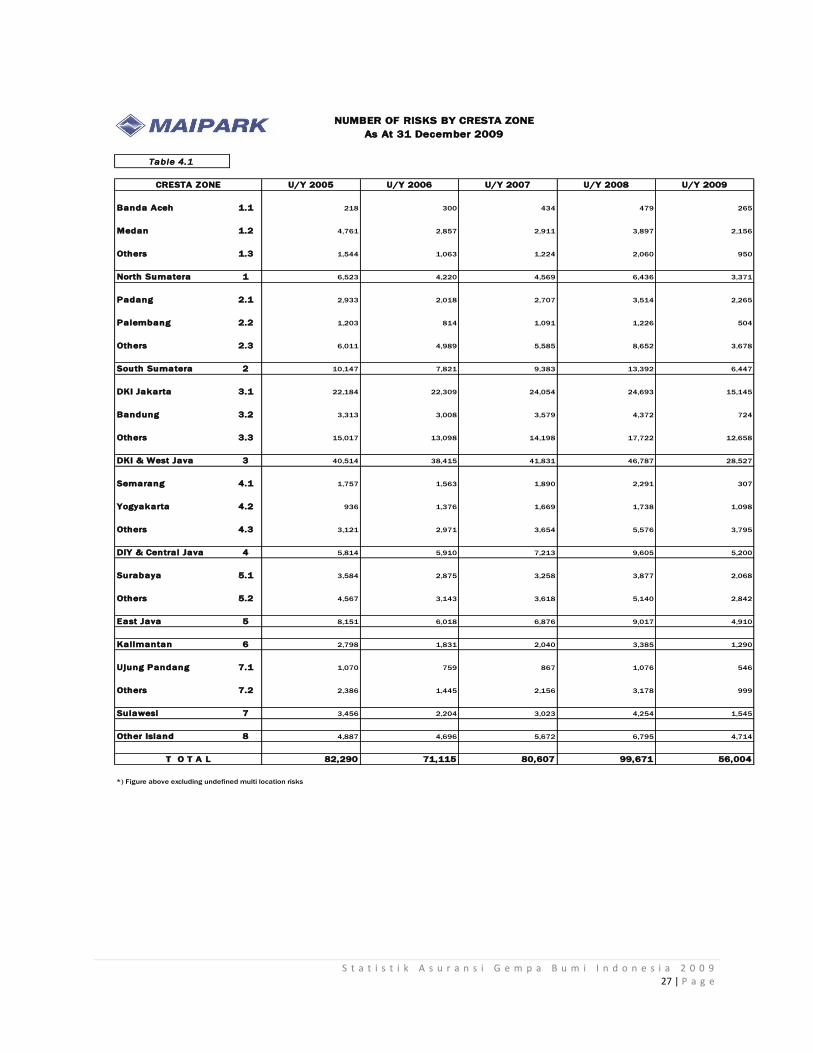
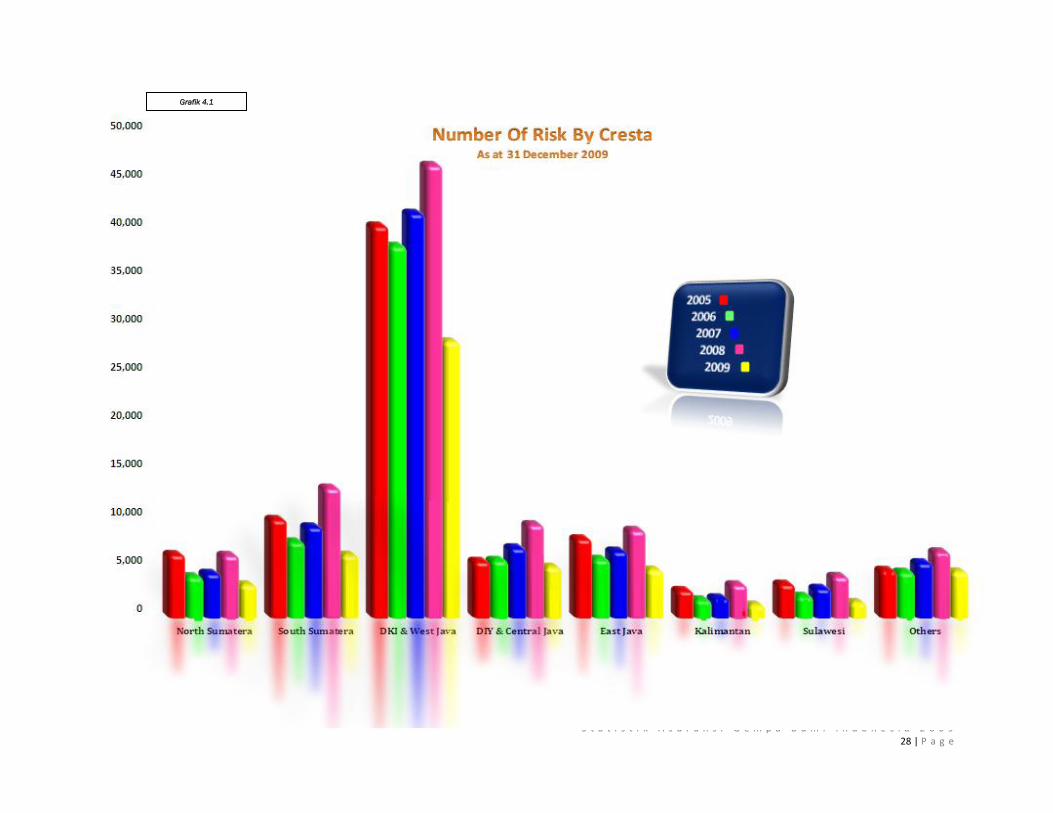
D. Jumlah Risiko Seiring dengan pertumbuhan jumlah premi bruto yang terus meningkat, jumlah risiko asuransi gempa bumi juga terus meningkat. Tercatat sampai dengan 31 Desember 2009, jumlah risiko gempa bumi untuk tahun underwriting 2006 adalah 71.115 risiko, di tahun underwriting 2007, jumlah tersebut naik sebesar 13% menjadi 80.607 risiko. Untuk tahun underwriting 2008 jumlah risiko naik cukup signifikan, dengan kenaikan sebesar 24% dibanding dengan tahun underwriting 2007. Sedangkan untuk tahun underwriting 2009, jumlah risiko tercatat sebanyak 56,004 risiko. Angka ini akan terus bertambah, karena pensesian masih terus berlangsung. Table dibawah ini menyajikan jumlah risiko, namun tidak termasuk risiko multilokasi yg tidak lengkap datanya, dimana kami kesulitan memisahkannya untuk menjadi satu risiko. .
D. Number of Risks The gross premium of earthquake insurance grows as well as the number of earthquake risk. As at 31 December 2009, it is recorded that earthquake risks for underwriting year 2006 is 71.115 risks. In underwriting year 2007 these are 80.607 risks or increased by 13%. For underwriting year 2008, the number of risks increased significantly by 24% compared to underwriting year 2007. In the meantime, the number of risk for underwriting year 2009 is 56.004 risks and will keep increasing since the cession still continues. The following table shows earthquake number of risks, excluding undefined multi location risks as we see it difficult to separate them into single risk.
Tabel 1.4 / Table 1.4
Agricultural 464 1% 413 1% 619 1% 281 1%
Commercial 38,084 54% 38,175 47% 56,980 57% 29,934 53%
Industrial 8,969 13% 11,395 14% 9,314 9% 6,108 11%
Residential 23,598 33% 30,624 38% 32,758 33% 19,681 35%
Total 71,115 80,607 99,671 56,004
Okupasi2009200820072006
Tahun Underwriting / Underwriting Year
Pertumbuhan Jumlah Risiko Asuransi Gempa Bumi Earthquake Insurance Risk Number Development
Per / As At 31 Dec 2009
*) Tidak termasuk risiko multilokasi yang tidak terdefinisi secara lengkap / excluding undefined multilocation risks
Tabel 1.5 / Table 1.5
S t a t i s t i k A s u r a n s i G e m p a B u m i I n d o n e s i a 2 0 0 9 7 | P a g e
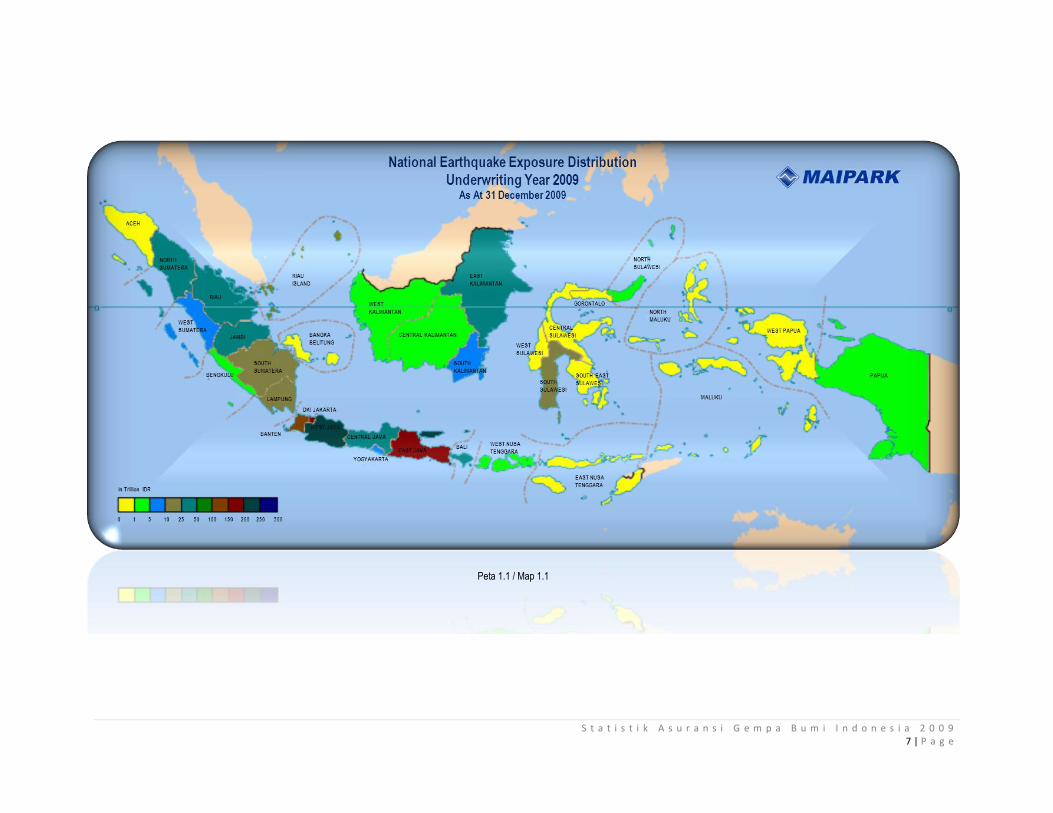
Peta 1.1 / Map 1.1
S t a t i s t i k A s u r a n s i G e m p a B u m i I n d o n e s i a 2 0 0 9 8 | P a g e
E. Pertumbuhan Incurred Claim Yang dimaksud dengan Incurred claim adalah klaim dibayar ditambah dengan klaim yang masih dalam proses penyelesaian. Tahun 2009 ini adalah tahun yang teramat berat bagi bangsa ini. Berbagai bencana gempa bumi terjadi, seperti gempa Padang, gempa Tasikmalaya, dan gempa Papua. Di awal tahun 2009, sebuah gempa besar menghantam Manokwari, Provinsi Papua Barat. Empat orang dinyatakan meninggal dunia, lebih dari 66 orang luka, dan lebih dari 500 rumah rusak parah. Gempa pertama terjadi pada tanggal 4 januari 2009, pukul 02.43.51 waktu setempat dengan skala 7,2 richter, lokasi pusat gempa berada di 135km timur laut Manokwari. Diikuti oleh gempa susulan sebesar 7,6 pada pukul 05.33.40 yang berlokasi pada 95 km barat Manokwari pada kedalaman 10 km. Bencana gempa bumi kemudian terjadi pula di pulau jawa. Pada tanggal 02 September 2009, warga Jakarta panik hingga berhamburan keluar rumah dan gedung. Gempa tektonik berkekuatan 7,3 pada skala richter mengguncang Tasikmalaya, Jawa Barat. Korban Jiwa dan kerugian material meluas, tak hanya di Tasikmalaya, namun hingga ke Cianjur, Garut, Sukabumi, Bandung, Bogor dan Ciamis. Sejumlah desa bahkan habis tertimpa longsor akibat gempa. Badan Penanggulangan Bencana Nasional (BNPB) mencatat setidaknya 10.000 unit rumah rusak berat. Data ini belum termasuk kerusakan ratusan fasilitas umum seperti sekolah, tempat Ibadah, dan kantor.
E. Growth of Incurred Claim It is claim paid plus outstanding claims. Year 2009 is the hardest year for Indonesia due to numbers of big earthquakes occurred in Padang, Tasikmalaya and Papua. At the beginning of the year 2009, a powerful earthquake hit Manokwari, West Papua Province. 4 people died and over 66 people injured while more than 500 buildings were heavily damaged. The first earthquake struck at 02:43:51 local time on 4 January 2009 on 7.2 Richter magnitude scale, located in 135 km Northwest of Manokwari, it is followed by 7.6 Mw at 05.33:40 WIB located on 95 km west of Manokwari both onshore in depth of 10 km. The earthquake also occurred later on the Java Island. On 2 September 2009, residents of Jakarta were panic and jumped out of the house and buildings. Tectonic earthquake measuring 7.3 on the Richter scale shocked Tasikmalaya, West Java. Fatalities and material damage were widespread, not only in Tasikmalaya, but up to Cianjur, Garut, Sukabumi, Bandung, Bogor and Ciamis. Some villages were crushed by landslides caused by the earthquake. The National Disaster Management Agency (BNPB) recorded at least 10,000 housing units were severely damaged. This data did not include damages to hundreds of public facilities such as schools, places of worship, and offices.
S t a t i s t i k A s u r a n s i G e m p a B u m i I n d o n e s i a 2 0 0 9 9 | P a g e
Pada tanggal 30 September 2009, gempa berkekuatan 7,6 skala richter menghantam wilayah Sumatera Barat dan sekitarnya. Gempa menyebabkan kerusakan parah di beberapa wilayah di Sumatera Barat seperti Kabupaten Padang Pariaman, Kota Padang, Kabupaten Pesisir Selatan, Kota Pariaman, Kota Bukittinggi, Kota Padangpanjang, Kabupaten Agam, Kota Solok, dan Kabupaten Pasaman Barat. Provinsi Sumatera Barat secara geografis berada di antara pertemuan dua lempeng benua besar (lempeng Eurasia dan lempeng Indo-Australia) dan patahan (sesar) Semangko. Di dekat pertemuan kedua lempeng terdapat patahan Mentawai. Ketiganya merupakan daerah seismik aktif. Menurut catatan ahli, gempa wilayah Sumatera Barat memiliki siklus 200 tahunan. Gempa besar yang pada awal abad ke-21 telah memasuki masa berulangnya siklus. Bencana gempa ini sendiri merupakan akibat dua gempa yang terjadi kurang dari 24 jam pada lokasi yang relatif berdekatan. Pada hari Rabu 30 September terjadi gempa berkekuatan 7,6 pada Skala Richter dengan pusat gempa (episentrum) 57 km di barat daya Kota Pariaman (00,84 LS 99,65 BT) pada kedalaman (hiposentrum) 71 km. Pada hari Kamis 1 Oktober terjadi lagi gempa kedua dengan kekuatan 6,8 Skala Richter, kali ini berpusat di 46 km tenggara Kota Sungai penuh pada pukul 08.52 WIB dengan kedalaman 24 km. Gempa pertama terjadi pada daerah patahan Mentawai (di bawah laut) sementara gempa kedua terjadi pada patahan Semangko di daratan. Menurut data Satkorlak Penanggulangan
Bencana, sedikitnya 1.117 orang tewas akibat
gempa ini yang tersebar di 3 kota dan 4
kabupaten di Sumatera Barat, korban luka berat
mencapai 1.214 orang, luka ringan 1.688 orang,
korban hilang 1 orang. Sedangkan 135.448
rumah rusak berat, 65.380 rumah rusak sedang,
& 78.604 rumah rusak ringan. Jumlah
On September 30, 2009, an earthquake
measuring 7.6 Richter scale hit West Sumatra
and the surrounding regions. The earthquake
caused severe damages in several areas in West
Sumatera like Padang Pariaman Regency, Kota
Padang, Pesisir Selatan District, Pariaman,
Bukittinggi, Padangpanjang, Agam District,
Solok, and West Pasaman district.
West Sumatra Province is geographically located between the confluence of two major continental plates (the Eurasian plate and the Indo-Australian plate) and fracture (fault) Semangko. Near, by there is plate Mentawai. All are active seismic areas. According to the experts study, the earthquake region of West Sumatra has a cycle of 200 years. Large earthquake in the early 21st century has entered a period of recurrence of the cycle. The earthquake itself was the result of two earthquakes that occurred less than 24 hours at a location relatively close together. On Wednesday, September 30, an earthquake measuring 7.6 on the Richter Scale with epicenter of the earthquake (epicenter) 57 km to the southwest city of Pariaman (00,84 LS 99.65 BT) at a depth (hiposentrum) 71 km. On Thursday, October 1 occurred again with a force of 6.8 earthquakes on the Richter scale, centered at 46 km southeast of Sungai Penuh at 8:52 pm with a depth of 24 km. The first earthquake occurred in the Mentawai fault area (under the sea) while the second quake occurred on the fault Semangko on the mainland. According to Satkorlak Penanggulangan Bencana, at least 1.117 people died in this earthquake, spread over 3 cities and 4 districts in West Sumatra. Serious injured casualties reached 1.214, 1.688 people were slightly injured; the victim lost was 1 person. Meanwhile, 135,448 houses were severely damaged, 65,380 houses were moderately damaged, and 78,604 houses were lightly

S t a t i s t i k A s u r a n s i G e m p a B u m i I n d o n e s i a 2 0 0 9 10 | P a g e
kerugian ekonomi gempa ini, seperti yang
dilaporkan oleh wakil gubernur Sumatera Barat
berdasarkan verifikasi final adalah sebesar Rp.
21.580 milliar.
Kerugian asuransi atas gempa pariaman ini dipastikan akan sangat besar. Menurut catatan per 31 Desember 2009, jumlah incurred claim akibat gempa ini telah mencapai Rp. 835,33 milliar. Kerugian asuransi ini jauh lebih besar dari kerugian gempa bumi Yogyakarta 2006 lalu, yang per 31 Desember 2009 ini, tercatat hanya Rp. 336,43 milliar. Diperkirakan angka ini akan terus bertambah, karena masih banyak klaim yang masih dalam penilaian. Berdasarkan data per tanggal 31 Desember 2009, Besar kerugian asuransi akibat bencana alam di tahun ini sebesar Rp. 969.473,90 milliar. Ini adalah kerugian asuransi terbesar sepanjang Maipark berdiri di tahun 2004. Grafik dibawah ini menunjukkan jumlah kerugian asuransi gempa bumi yang dilaporkan sepanjang tahun 2004 hingga 2009 ini.
damaged. Economic loss of Pariaman earthquake, as reported on final verification report by deputy governor of West Sumatera mentioned that economic loss is Rp. 21.580 billion. Insured Loss on Pariaman earthquake will certainly enormous. As of December 31, 2009, the number of incurred claim by the quake reached Rp. 835.33 billion. Insured loss was far greater than the loss of Yogyakarta earthquake in 2006, as at 31 December 2009, accounted for only Rp. 336.43 billion. It is estimated that this figure will continue to grow, because there are still many claims revisions. Based on data as of December 31, 2009, the big insured loss from natural disasters this year amounted to Rp. 969,473.90 billion. It is the biggest insured loss since the establishment of Maipark in 2004. The graphic below tells us about earthquake insured loss reported for 2004 - 2009.
Grafik 1.3 / Graph 1.3
Kerugian Asuransi Gempa Bumi Yang Dilaporkan 2004 - 2009 Earthquake Insurance Insured Loss 2004 - 2009
Per / As At 31 Dec 2009
Dalam Jutaan Rupiah In Million Rupiah
615,842.93
3,726.34
339,259.25
111,230.06 18,680.67
969,473.90
2004 2005 2006 2007 2008 2009
S t a t i s t i k A s u r a n s i G e m p a B u m i I n d o n e s i a 2 0 0 9 11 | P a g e
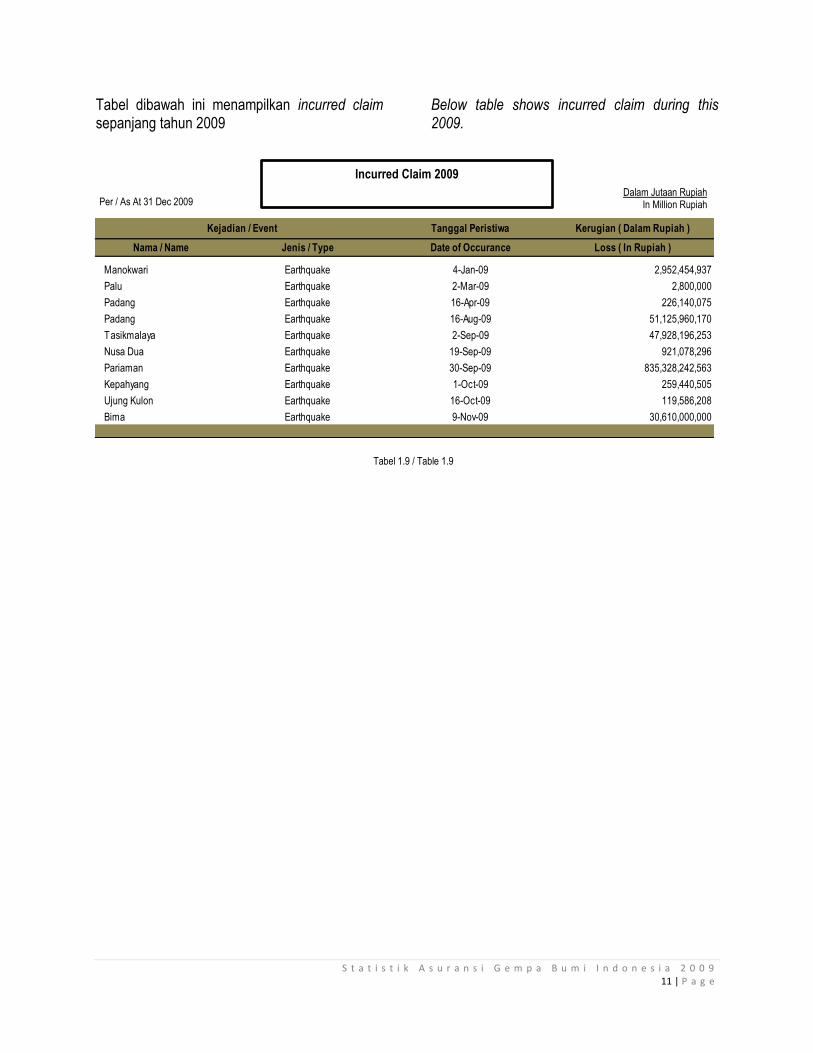
Tabel dibawah ini menampilkan incurred claim sepanjang tahun 2009
Below table shows incurred claim during this 2009.
Tanggal Peristiwa Kerugian ( Dalam Rupiah )
Nama / Name Jenis / Type Date of Occurance Loss ( In Rupiah )
Manokwari Earthquake 4-Jan-09 2,952,454,937
Palu Earthquake 2-Mar-09 2,800,000
Padang Earthquake 16-Apr-09 226,140,075
Padang Earthquake 16-Aug-09 51,125,960,170
Tasikmalaya Earthquake 2-Sep-09 47,928,196,253
Nusa Dua Earthquake 19-Sep-09 921,078,296
Pariaman Earthquake 30-Sep-09 835,328,242,563
Kepahyang Earthquake 1-Oct-09 259,440,505
Ujung Kulon Earthquake 16-Oct-09 119,586,208
Bima Earthquake 9-Nov-09 30,610,000,000
Kejadian / Event
Incurred Claim 2009
Tabel 1.9 / Table 1.9
Per / As At 31 Dec 2009 Dalam Jutaan Rupiah
In Million Rupiah

S t a t i s t i k A s u r a n s i G e m p a B u m i I n d o n e s i a 2 0 0 9 12 | P a g e
Peta 1.2 / Map 1.2

S t a t i s t i k A s u r a n s i G e m p a B u m i I n d o n e s i a 2 0 0 9 13 | P a g e
Table dibawah ini menyajikan pertumbuhan klaim dari semua event 2004 – 2009.
This following table shows claim development for all claim events during period of 2004 – 2010.
Tanggal Peristiwa
Nama Jenis
Name Type 2008 2009
Bali Earthquake 2-Jan-04 4,070,000
Padang Earthquake 16-Feb-04 12,402,600 12,402,600
Nabire Earthquake 26-Nov-04 3,299,345,206 3,299,345,206
Aceh Earthquake 26-Dec-04 612,226,619,221 612,531,185,533
Cilegon Earthquake 15-Jan-05 780,267,740 816,431,678
Ambon Earthquake 2-Mar-05 348,125,037 348,125,037
Nias Earthquake 28-Mar-05 2,608,811,120 1,149,513,632
Padang Earthquake 10-Apr-05 1,399,712,953 1,412,272,780
Sibolga Earthquake 95,000,000
TBA Earthquake 800,000,000
Tanjung Karang Earthquake 12-May-06 33,575,300 33,575,300
Sibolga Earthquake 19-May-06 7,612,000
Yogyakarta Earthquake 27-May-06 255,920,900,053 336,432,968,532
Pangandaran Earthquake 17-Jul-06 2,418,989,460 2,428,124,860
Jakarta Earthquake 19-Jul-06 257,918,125 242,903,125
Wonosari Earthquake 22-Sep-06 97,589,358 97,589,358
Pandeglang Earthquake 24-Dec-06 16,477,760 16,477,760
Manado Earthquake 21-Jan-07 428,830,661 503,894,784
Padang Earthquake 6-Mar-07 47,672,720,251 44,471,563,444
Bukittingggi Earthquake 13-Mar-07 22,500,000 22,500,000
Cipanas Earthquake 27-Jul-07 36,699,006
Jakarta Earthquake 9-Aug-07 5,641,754,146 5,729,674,675
Carita Earthquake 10-Aug-07 14,271,971 14,271,971
Jakarta Earthquake 26-Aug-07 30,587,366
Bengkulu Earthquake 12-Sep-07 75,203,058,711 60,321,833,456
Denpasar Earthquake 8-Oct-07 32,543,000 82,035,138
Painan Earthquake 24-Oct-07 12,906,700 12,906,700
Dompu Earthquake 25-Nov-07 15,000,000 4,090,000
Manokwari Earthquake 7-Jan-08 1,922,050,000 1,073,890,300
Painan Earthquake 25-Feb-08 2,511,494,000 503,923,036
Benkulu Earthquake 3-Apr-08 50,000,000 50,000,000
Padang Earthquake 28-Jul-08 55,416,667 44,535,354
Pekat Earthquake 7-Aug-08 10,475,000,000 15,863,721,995
Padang Earthquake 8-Aug-08 57,192,354
Rababima Earthquake 28-Aug-08 450,000,000 358,349,490
Lahat Earthquake 9-Sep-08 974,500
Sukabumi Earthquake 10-Oct-08 115,000,000
Bandung Earthquake 11-Oct-08
Gorontalo Earthquake 17-Nov-08 821,873,750 559,100,686
Aceh Earthquake 21-Dec-08 53,980,575
Manokwari Earthquake 4-Jan-09 2,952,454,937
TBA Earthquake 26-Jan-09
TBA Earthquake 10-Feb-09
Palu Earthquake 2-Mar-09 2,800,000
Padang Earthquake 16-Apr-09 226,140,075
TBA Earthquake 8-May-09
Padang Earthquake 16-Aug-09 51,125,960,170
Tasikmalaya Earthquake 2-Sep-09 47,928,196,253
Nusa Dua Earthquake 19-Sep-09 921,078,296
Pariaman Earthquake 30-Sep-09 835,328,242,563
Kepahyang Earthquake 1-Oct-09 259,440,505
TBA Earthquake 9-Oct-09
Manokwari Earthquake 15-Oct-09
Ujung Kulon Earthquake 16-Oct-09 119,586,208
Bima Earthquake 9-Nov-09 30,610,000,000
1,025,649,223,788.76 2,058,213,151,237.79
Kejadian / Event
Per 31 Desember /As At 31 December
Klaim Reported / Claim Reported
Date of
Occurance
Pertumbuhan Incured Claim Semua Kejadian 2004 - 2010 Earthquake Insurance Incurred Claim All Event 2004 - 2010
Tabel 2.0 / Table 2.0

S t a t i s t i k A s u r a n s i G e m p a B u m i I n d o n e s i a 2 0 0 9 14 | P a g e
Peta 1.3 / Map 1.3
S t a t i s t i k A s u r a n s i G e m p a B u m i I n d o n e s i a 2 0 0 9 15 | P a g e
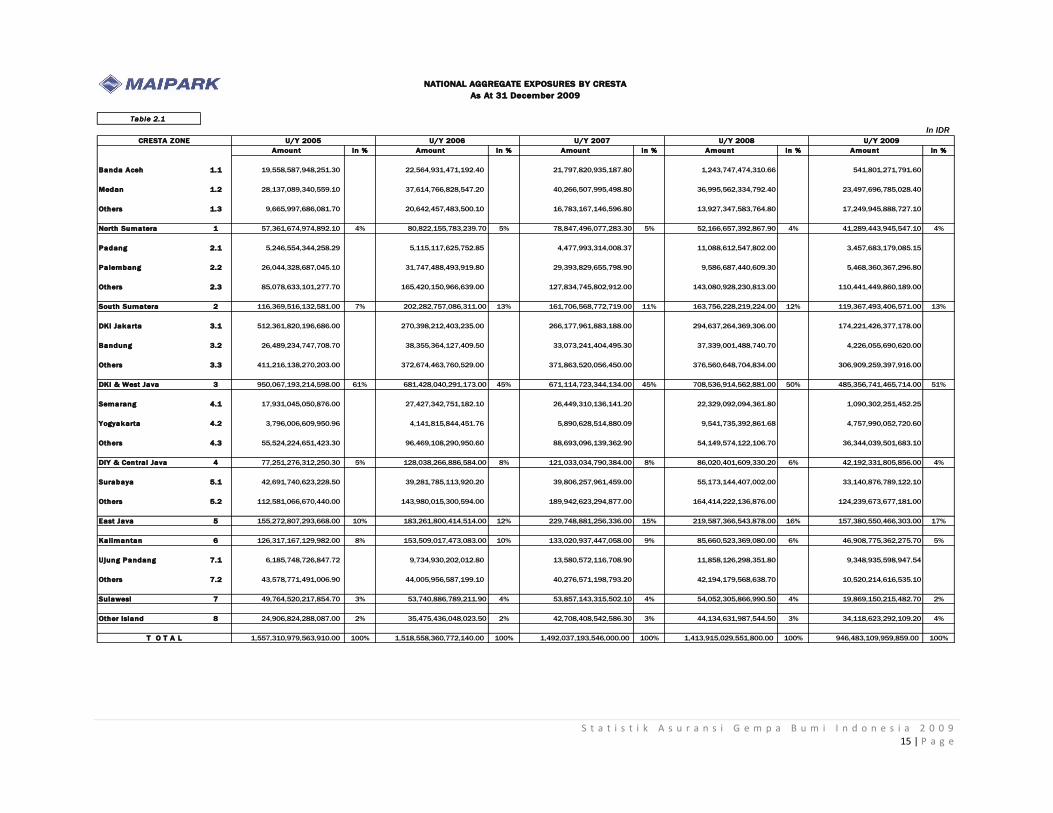
Table 2.1
In IDR
Amount in % Amount in % Amount in % Amount in % Amount in %
Banda Aceh 1.1 19,558,587,948,251.30 22,564,931,471,192.40 21,797,820,935,187.80 1,243,747,474,310.66 541,801,271,791.60
Medan 1.2 28,137,089,340,559.10 37,614,766,828,547.20 40,266,507,995,498.80 36,995,562,334,792.40 23,497,696,785,028.40
Others 1.3 9,665,997,686,081.70 20,642,457,483,500.10 16,783,167,146,596.80 13,927,347,583,764.80 17,249,945,888,727.10
North Sumatera 1 57,361,674,974,892.10 4% 80,822,155,783,239.70 5% 78,847,496,077,283.30 5% 52,166,657,392,867.90 4% 41,289,443,945,547.10 4%
Padang 2.1 5,246,554,344,258.29 5,115,117,625,752.85 4,477,993,314,008.37 11,088,612,547,802.00 3,457,683,179,085.15
Palembang 2.2 26,044,328,687,045.10 31,747,488,493,919.80 29,393,829,655,798.90 9,586,687,440,609.30 5,468,360,367,296.80
Others 2.3 85,078,633,101,277.70 165,420,150,966,639.00 127,834,745,802,912.00 143,080,928,230,813.00 110,441,449,860,189.00
South Sumatera 2 116,369,516,132,581.00 7% 202,282,757,086,311.00 13% 161,706,568,772,719.00 11% 163,756,228,219,224.00 12% 119,367,493,406,571.00 13%
DKI Jakarta 3.1 512,361,820,196,686.00 270,398,212,403,235.00 266,177,961,883,188.00 294,637,264,369,306.00 174,221,426,377,178.00
Bandung 3.2 26,489,234,747,708.70 38,355,364,127,409.50 33,073,241,404,495.30 37,339,001,488,740.70 4,226,055,690,620.00
Others 3.3 411,216,138,270,203.00 372,674,463,760,529.00 371,863,520,056,450.00 376,560,648,704,834.00 306,909,259,397,916.00
DKI & West Java 3 950,067,193,214,598.00 61% 681,428,040,291,173.00 45% 671,114,723,344,134.00 45% 708,536,914,562,881.00 50% 485,356,741,465,714.00 51%
Semarang 4.1 17,931,045,050,876.00 27,427,342,751,182.10 26,449,310,136,141.20 22,329,092,094,361.80 1,090,302,251,452.25
Yogyakarta 4.2 3,796,006,609,950.96 4,141,815,844,451.76 5,890,628,514,880.09 9,541,735,392,861.68 4,757,990,052,720.60
Others 4.3 55,524,224,651,423.30 96,469,108,290,950.60 88,693,096,139,362.90 54,149,574,122,106.70 36,344,039,501,683.10
DIY & Central Java 4 77,251,276,312,250.30 5% 128,038,266,886,584.00 8% 121,033,034,790,384.00 8% 86,020,401,609,330.20 6% 42,192,331,805,856.00 4%
Surabaya 5.1 42,691,740,623,228.50 39,281,785,113,920.20 39,806,257,961,459.00 55,173,144,407,002.00 33,140,876,789,122.10
Others 5.2 112,581,066,670,440.00 143,980,015,300,594.00 189,942,623,294,877.00 164,414,222,136,876.00 124,239,673,677,181.00
East Java 5 155,272,807,293,668.00 10% 183,261,800,414,514.00 12% 229,748,881,256,336.00 15% 219,587,366,543,878.00 16% 157,380,550,466,303.00 17%
Kalimantan 6 126,317,167,129,982.00 8% 153,509,017,473,083.00 10% 133,020,937,447,058.00 9% 85,660,523,369,080.00 6% 46,908,775,362,275.70 5%
Ujung Pandang 7.1 6,185,748,726,847.72 9,734,930,202,012.80 13,580,572,116,708.90 11,858,126,298,351.80 9,348,935,598,947.54
Others 7.2 43,578,771,491,006.90 44,005,956,587,199.10 40,276,571,198,793.20 42,194,179,568,638.70 10,520,214,616,535.10
Sulawesi 7 49,764,520,217,854.70 3% 53,740,886,789,211.90 4% 53,857,143,315,502.10 4% 54,052,305,866,990.50 4% 19,869,150,215,482.70 2%
Other Island 8 24,906,824,288,087.00 2% 35,475,436,048,023.50 2% 42,708,408,542,586.30 3% 44,134,631,987,544.50 3% 34,118,623,292,109.20 4%
1,557,310,979,563,910.00 100% 1,518,558,360,772,140.00 100% 1,492,037,193,546,000.00 100% 1,413,915,029,551,800.00 100% 946,483,109,959,859.00 100%
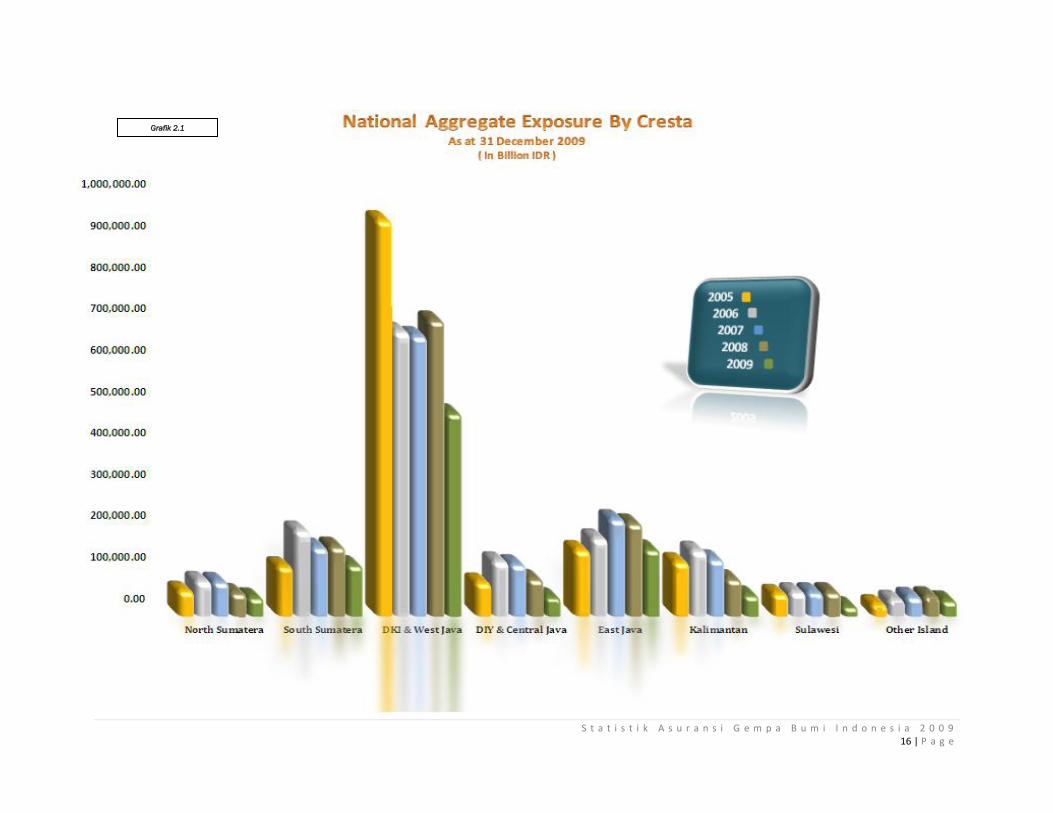
NATIONAL AGGREGATE EXPOSURES BY CRESTA
As At 31 December 2009
U/Y 2008
T O T A L
U/Y 2007U/Y 2005 U/Y 2006 U/Y 2009CRESTA ZONE
S t a t i s t i k A s u r a n s i G e m p a B u m i I n d o n e s i a 2 0 0 9 16 | P a g e
Grafik 2.1
S t a t i s t i k A s u r a n s i G e m p a B u m i I n d o n e s i a 2 0 0 9 17 | P a g e
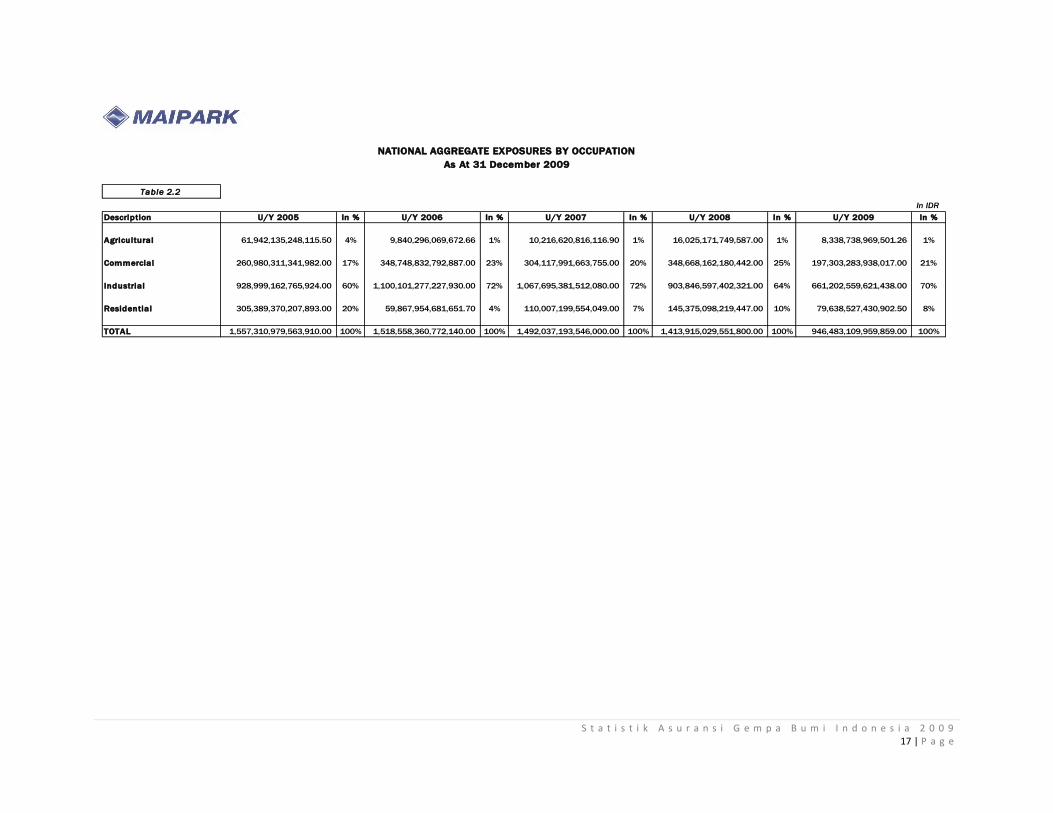
Table 2.2
In IDR
Description U/Y 2005 In % U/Y 2006 In % U/Y 2007 In % U/Y 2008 In % U/Y 2009 In %
Agricultural 61,942,135,248,115.50 4% 9,840,296,069,672.66 1% 10,216,620,816,116.90 1% 16,025,171,749,587.00 1% 8,338,738,969,501.26 1%
Commercial 260,980,311,341,982.00 17% 348,748,832,792,887.00 23% 304,117,991,663,755.00 20% 348,668,162,180,442.00 25% 197,303,283,938,017.00 21%
Industrial 928,999,162,765,924.00 60% 1,100,101,277,227,930.00 72% 1,067,695,381,512,080.00 72% 903,846,597,402,321.00 64% 661,202,559,621,438.00 70%
Residential 305,389,370,207,893.00 20% 59,867,954,681,651.70 4% 110,007,199,554,049.00 7% 145,375,098,219,447.00 10% 79,638,527,430,902.50 8%
TOTAL 1,557,310,979,563,910.00 100% 1,518,558,360,772,140.00 100% 1,492,037,193,546,000.00 100% 1,413,915,029,551,800.00 100% 946,483,109,959,859.00 100%
NATIONAL AGGREGATE EXPOSURES BY OCCUPATION
As At 31 December 2009

S t a t i s t i k A s u r a n s i G e m p a B u m i I n d o n e s i a 2 0 0 9 18 | P a g e
Grafik 2.2

S t a t i s t i k A s u r a n s i G e m p a B u m i I n d o n e s i a 2 0 0 9 19 | P a g e
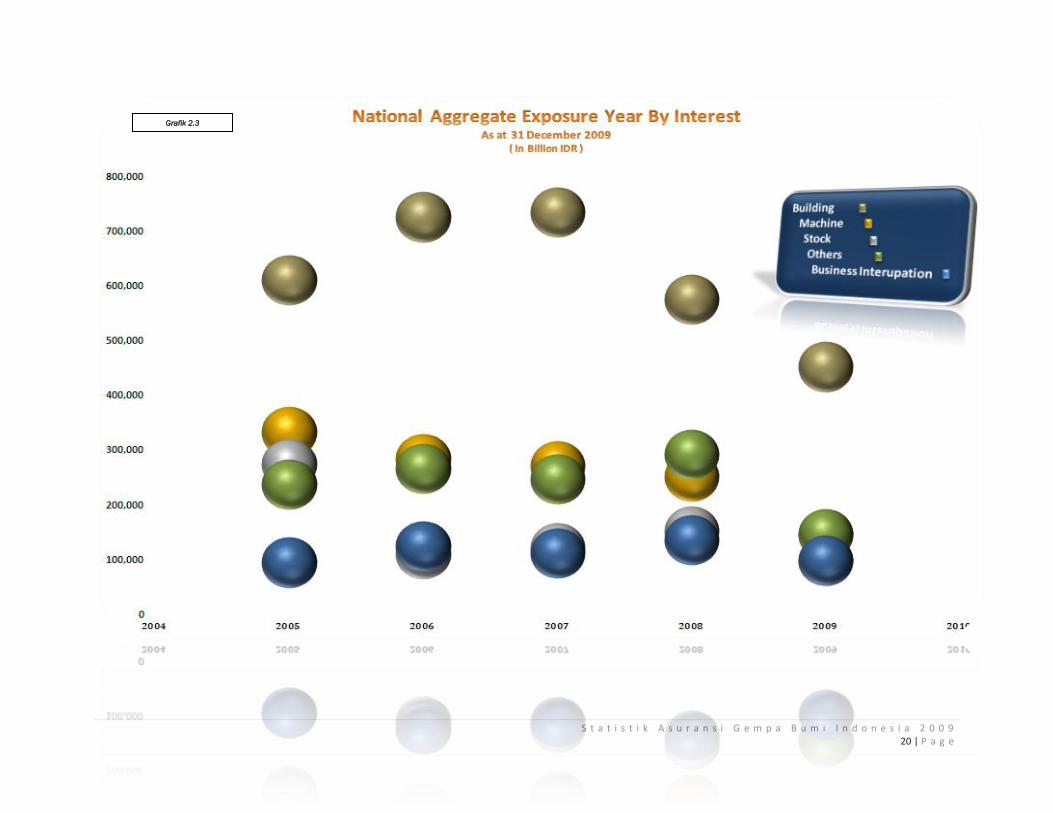
Table 2.3
In IDR
Description U/Y 2005 U/Y 2006 U/Y 2007 U/Y 2008 U/Y 2009
Building 611,861,631,011,181.00 727,455,323,232,449.00 736,242,851,910,110.00 577,468,015,660,992.00 453,573,040,517,034.00
Machinery 334,317,430,934,478.00 285,910,590,803,287.00 272,395,523,967,001.00 253,272,388,118,646.00 146,611,985,761,144.00
Stock 276,065,895,579,831.00 111,804,961,583,085.00 122,830,495,226,567.00 153,589,718,386,021.00 98,199,282,713,536.00
Others 239,120,244,536,531.00 267,095,822,076,663.00 248,205,135,610,190.00 293,050,408,893,822.00 147,760,392,679,351.00
SUB TOTAL 1,461,365,202,062,020.00 1,392,266,697,695,480.00 1,379,674,006,713,870.00 1,277,380,531,059,480.00 846,144,701,671,066.00
Business Interruption 95,945,777,501,893.80 126,291,663,076,656.00 112,363,186,832,136.00 136,534,498,492,316.00 100,338,408,288,793.00
T O T A L 1,557,310,979,563,910.00 1,518,558,360,772,140.00 1,492,037,193,546,000.00 1,413,915,029,551,800.00 946,483,109,959,859.00
NATIONAL AGGREGATE EXPOSURES BY INTEREST
As At 31 December 2009
S t a t i s t i k A s u r a n s i G e m p a B u m i I n d o n e s i a 2 0 0 9 20 | P a g e
Grafik 2.3
S t a t i s t i k A s u r a n s i G e m p a B u m i I n d o n e s i a 2 0 0 9 21 | P a g e
In IDR
Amount in % Amount in % Amount in % Amount in %
1 Nanggroe Aceh Darussalam 23,222,469,030,663 1.53% 24,972,224,260,762 1.67% 4,574,682,657,827 0.32% 782,365,429,802 0.08%
2 Sumatera Utara 57,599,686,752,577 3.79% 53,875,271,816,521 3.61% 47,591,974,735,041 3.37% 40,507,078,515,746 4.28%
3 Sumatera Barat 11,803,237,469,684 0.78% 8,992,716,716,874 0.60% 16,303,250,037,684 1.15% 7,767,706,269,350 0.82%
4 Riau 106,250,386,674,915 7.00% 68,958,266,404,896 4.62% 68,137,306,748,043 4.82% 27,762,414,804,006 2.93%
5 Jambi 4,357,669,826,183 0.29% 3,622,773,662,240 0.24% 4,185,096,088,953 0.30% 28,589,990,611,256 3.02%
6 Sumatera Selatan 50,170,938,429,080 3.30% 46,176,884,371,846 3.09% 27,211,971,305,340 1.92% 20,172,454,290,478 2.13%
7 Bengkulu 1,090,793,435,087 0.07% 1,227,599,398,637 0.08% 2,673,025,232,884 0.19% 1,737,517,134,516 0.18%
8 Lampung 15,158,238,620,892 1.00% 17,128,769,552,469 1.15% 27,343,348,285,755 1.93% 19,364,713,305,527 2.05%
9 Kepulauan Bangka Belitung 926,110,341,839 0.06% 149,313,067,118 0.01% 2,477,887,610,958 0.18% 547,824,551,103 0.06%
10 Kepulauan Riau 12,525,382,288,631 0.82% 15,450,245,598,639 1.04% 15,424,342,909,608 1.09% 13,424,872,440,335 1.42%
11 DKI Jakarta 270,398,212,403,235 17.81% 266,177,961,883,188 17.84% 294,637,264,369,306 20.84% 174,221,426,377,178 18.41%
12 Jawa Barat 256,788,556,957,487 16.91% 261,142,622,874,084 17.50% 261,612,191,175,470 18.50% 200,147,184,887,907 21.15%
13 Jawa Tengah 123,535,065,522,968 8.14% 114,707,453,791,809 7.69% 75,548,464,334,883 5.34% 37,122,245,896,025 3.92%
14 DI. Yogyakarta 4,503,201,363,617 0.30% 6,325,580,998,575 0.42% 10,471,937,274,448 0.74% 5,070,085,909,831 0.54%
15 Jawa Timur 183,261,800,414,514 12.07% 229,748,881,256,336 15.40% 219,587,366,543,878 15.53% 157,380,550,466,303 16.63%
16 Banten 154,241,270,930,452 10.16% 143,794,138,586,862 9.64% 152,287,459,018,104 10.77% 110,988,130,200,629 11.73%
17 Bali 22,095,799,557,558 1.46% 25,469,732,730,428 1.71% 34,386,793,860,389 2.43% 28,258,367,074,155 2.99%
18 Kalimantan Barat 1,755,343,725,658 0.12% 1,823,275,121,773 0.12% 2,568,186,902,395 0.18% 1,380,476,888,062 0.15%
19 Kalimantan Tengah 2,840,199,371,595 0.19% 2,747,177,576,000 0.18% 3,351,976,232,714 0.24% 4,073,009,044,169 0.43%
20 Kalimantan Selatan 16,425,535,541,263 1.08% 19,051,779,243,047 1.28% 34,182,207,541,635 2.42% 8,553,864,295,883 0.90%
21 Kalimantan Timur 132,487,938,834,567 8.72% 109,398,705,506,239 7.33% 45,558,152,692,335 3.22% 32,901,425,134,161 3.48%
22 Sulawesi Utara 4,044,025,703,653 0.27% 4,336,122,366,985 0.29% 3,769,435,935,249 0.27% 2,817,088,276,743 0.30%
23 Sulawesi Tengah 932,489,065,038 0.06% 1,389,415,978,487 0.09% 1,331,354,197,536 0.09% 783,701,010,841 0.08%
24 Sulawesi Selatan 14,258,541,449,464 0.94% 18,864,248,655,904 1.26% 18,025,425,788,216 1.27% 14,762,918,538,062 1.56%
25 Sulawesi Tenggara 34,044,852,282,949 2.24% 28,717,770,322,555 1.92% 30,341,023,803,838 2.15% 871,831,789,452 0.09%
26 Gorontalo 415,250,424,999 0.03% 474,303,802,854 0.03% 459,556,664,246 0.03% 176,177,289,895 0.02%
27 Sulawesi Barat 45,727,863,109 0.00% 75,282,188,717 0.01% 125,509,477,905 0.01% 457,433,310,490 0.05%
28 Nusa Tenggara Barat 1,688,945,797,799 0.11% 3,019,349,262,762 0.20% 2,016,032,579,217 0.14% 1,524,933,791,000 0.16%
29 Nusa Tenggara Timur 579,335,645,653 0.04% 417,028,971,049 0.03% 575,507,995,224 0.04% 348,267,026,135 0.04%
30 Maluku 847,060,371,383 0.06% 423,345,235,688 0.03% 361,246,408,670 0.03% 514,701,876,544 0.05%
31 Maluku Utara 46,800,369,415 0.00% 598,536,891,829 0.04% 513,301,830,627 0.04% 243,123,108,233 0.03%
32 Papua Barat 923,962,125,328 0.06% 956,628,512,641 0.06% 1,050,735,881,379 0.07% 979,122,470,498 0.10%
33 Papua 9,293,532,180,887 0.61% 11,823,786,938,190 0.79% 5,231,013,432,039 0.37% 2,250,107,945,545 0.24%
1,518,558,360,772,140 1,492,037,193,546,000 1,413,915,029,551,800 946,483,109,959,859
NATIONAL AGGREGATE EXPOSURES PER PROVINCE
As At 31 December 2009
U/Y 2009
T O T A L
U/Y 2008U/Y 2006 U/Y 2007
Table 2.4
PROVINCE
S t a t i s t i k A s u r a n s i G e m p a B u m i I n d o n e s i a 2 0 0 9 22 | P a g e
Table 3.1
In IDR
Amount in % Amount in % Amount in % Amount in % Amount in %
Banda Aceh 1.1 1,442,695,025.82 26,900,882,950.15 25,875,083,013.44 1,534,840,500.84 692,056,546.09
Medan 1.2 47,324,344,212.47 43,735,534,092.80 48,450,713,093.63 45,391,628,497.52 27,661,861,213.03
Others 1.3 10,685,128,215.06 23,592,711,393.87 17,848,428,643.70 16,908,491,388.07 20,705,794,186.22
North Sumatera 1 59,452,167,453.35 3% 94,229,128,436.82 5% 92,174,224,750.78 5% 63,834,960,386.43 4% 49,059,711,945.34 4%
Padang 2.1 5,915,742,165.67 5,820,893,038.13 4,957,806,707.07 13,484,664,445.59 4,292,800,450.18
Palembang 2.2 24,200,965,654.40 34,150,601,060.36 31,862,238,825.03 11,387,279,189.22 6,157,316,833.35
Others 2.3 66,501,280,533.21 168,635,685,608.90 139,264,245,209.03 179,022,813,019.94 120,850,653,403.10
South Sumatera 2 96,617,988,353.29 5% 208,607,179,707.39 12% 176,084,290,741.13 10% 203,894,756,654.75 11% 131,300,770,686.63 12%
DKI Jakarta 3.1 742,448,593,077.71 336,559,935,840.51 343,024,525,676.84 405,367,106,444.63 228,209,077,857.04
Bandung 3.2 47,570,832,732.21 44,477,233,600.54 40,049,648,774.34 49,301,390,699.51 5,297,822,559.44
Others 3.3 502,335,524,089.81 411,861,074,162.27 435,220,281,600.06 473,959,105,477.43 361,519,027,020.01
DKI & West Java 3 1,292,354,949,899.73 68% 792,898,243,603.32 46% 818,294,456,051.24 46% 928,627,602,621.57 51% 595,025,927,436.49 53%
Semarang 4.1 37,844,947,865.56 32,224,969,152.00 32,534,702,391.59 28,531,679,785.67 1,256,578,250.39
Yogyakarta 4.2 4,724,013,608.48 5,259,170,776.14 5,877,053,252.65 11,016,722,289.41 5,888,909,387.08
Others 4.3 23,571,849,348.65 111,468,942,721.90 106,492,249,853.08 68,054,460,951.00 42,361,993,058.42
DIY & Central Java 4 66,140,810,822.69 3% 148,953,082,650.03 9% 144,904,005,497.32 8% 107,602,863,026.09 6% 49,507,480,695.89 4%
Surabaya 5.1 57,987,665,454.16 46,218,862,733.85 49,778,971,284.14 65,879,117,582.56 39,158,088,838.49
Others 5.2 144,683,362,869.68 163,071,615,132.76 235,337,649,107.11 199,984,498,465.95 143,719,705,693.19
East Java 5 202,671,028,323.84 11% 209,290,477,866.61 12% 285,116,620,391.25 16% 265,863,616,048.51 15% 182,877,794,531.68 16%
Kalimantan 6 85,751,921,895.05 4% 178,619,161,748.68 10% 156,867,631,637.02 9% 107,796,769,319.78 6% 52,877,854,016.97 5%
Ujung Pandang 7.1 24,012,146,214.11 11,612,489,587.73 16,805,966,746.55 16,502,092,118.06 10,823,293,561.63
Others 7.2 43,431,243,217.23 47,709,200,997.85 48,001,669,232.14 50,844,079,005.54 11,963,228,599.47
Sulawesi 7 67,443,389,431.35 4% 59,321,690,585.58 3% 64,807,635,978.69 4% 67,346,171,123.60 4% 22,786,522,161.10 2%
Other Island 8 36,776,236,376.64 2% 42,469,250,284.99 2% 54,302,239,532.26 3% 58,626,440,326.56 3% 42,729,995,281.38 4%
1,907,208,492,555.94 1,734,388,214,883.42 1,792,551,104,579.69 1,803,593,179,507.28 1,126,166,056,755.48 T O T A L
CRESTA ZONEU/Y 2009
NATIONAL GROSS PREMIUM INCOME BY CRESTA ZONE
As At 31 December 2009
U/Y 2007U/Y 2005 U/Y 2006 U/Y 2008
S t a t i s t i k A s u r a n s i G e m p a B u m i I n d o n e s i a 2 0 0 9 23 | P a g e

S t a t i s t i k A s u r a n s i G e m p a B u m i I n d o n e s i a 2 0 0 9 24 | P a g e
Table 3.2
In IDR
Description U/Y 2005 In % U/Y 2006 In % U/Y 2007 In % U/Y 2008 In % U/Y 2009 In %
Agricultural 90,000,687,106.34 4.72% 10,320,755,425.88 0.60% 9,959,498,689.24 0.56% 17,316,518,971.41 0.96% 9,390,083,378.64 0.83%
Commercial 498,746,757,143.75 26.15% 427,602,684,321.90 24.65% 382,423,458,733.07 21.33% 441,838,266,503.01 24.50% 244,473,909,717.96 21.71%
Industrial 889,616,514,714.16 46.64% 1,219,152,631,538.73 70.29% 1,256,954,204,205.92 70.12% 1,145,631,250,704.99 63.52% 767,458,544,941.91 68.15%
Residential 428,844,533,591.68 22.49% 77,312,143,596.91 4.46% 143,213,942,951.48 7.99% 198,807,143,327.89 11.02% 104,843,518,716.98 9.31%
TOTAL 1,907,208,492,555.93 1,734,388,214,883.42 1,792,551,104,579.71 1,803,593,179,507.30 1,126,166,056,755.49
NATIONAL GROSS PREMIUM INCOME BY OCCUPATION
As At 31 December 2009
S t a t i s t i k A s u r a n s i G e m p a B u m i I n d o n e s i a 2 0 0 9 25 | P a g e
Grafik 3.2

S t a t i s t i k A s u r a n s i G e m p a B u m i I n d o n e s i a 2 0 0 9 26 | P a g e
In IDR
Amount in % Amount in % Amount in % Amount in %
1 Nanggroe Aceh Darussalam 27,649,788,917.10 1.59% 28,658,844,407.01 1.60% 6,018,115,544.05 0.33% 986,291,496.78 0.09%
2 Sumatera Utara 66,579,339,519.72 3.84% 63,515,380,343.76 3.54% 57,816,844,842.38 3.21% 48,073,420,448.56 4.27%
3 Sumatera Barat 13,037,516,281.91 0.75% 10,297,594,862.47 0.57% 19,691,025,587.05 1.09% 9,738,213,337.28 0.86%
4 Riau 106,350,289,691.26 6.13% 72,634,430,707.09 4.05% 90,968,881,176.96 5.04% 28,855,060,408.98 2.56%
5 Jambi 4,451,784,631.41 0.26% 4,027,193,017.80 0.22% 4,707,988,291.14 0.26% 30,704,826,531.80 2.73%
6 Sumatera Selatan 55,018,463,978.14 3.17% 51,297,160,581.41 2.86% 32,399,775,939.07 1.80% 23,543,848,627.75 2.09%
7 Bengkulu 1,245,133,959.10 0.07% 1,598,242,093.78 0.09% 3,390,814,727.25 0.19% 2,580,540,004.96 0.23%
8 Lampung 15,990,519,515.20 0.92% 19,843,539,280.63 1.11% 32,203,330,649.15 1.79% 22,018,528,130.91 1.96%
9 Kepulauan Bangka Belitung 678,063,867.99 0.04% 154,009,605.20 0.01% 3,337,046,985.34 0.19% 582,870,145.60 0.05%
10 Kepulauan Riau 11,835,407,782.38 0.68% 16,232,120,592.75 0.91% 17,195,893,298.79 0.95% 13,276,883,499.34 1.18%
11 DKI Jakarta 336,559,935,840.51 19.41% 343,024,525,676.84 19.14% 405,367,106,444.63 22.48% 228,209,077,857.04 20.26%
12 Jawa Barat 285,977,239,376.61 16.49% 306,473,957,404.90 17.10% 333,158,726,023.25 18.47% 234,771,247,129.56 20.85%
13 Jawa Tengah 143,295,051,805.81 8.26% 138,512,447,712.79 7.73% 95,235,540,560.77 5.28% 43,241,851,104.13 3.84%
14 DI. Yogyakarta 5,658,030,844.22 0.33% 6,391,557,784.53 0.36% 12,367,322,465.31 0.69% 6,265,629,591.76 0.56%
15 Jawa Timur 209,290,477,866.61 12.07% 285,116,620,391.25 15.91% 265,863,616,048.51 14.74% 182,877,794,531.68 16.24%
16 Banten 170,361,068,386.21 9.82% 168,795,972,969.49 9.42% 190,101,770,153.69 10.54% 132,045,602,449.89 11.73%
17 Bali 25,744,911,402.82 1.48% 32,221,430,862.19 1.80% 46,535,151,728.39 2.58% 35,567,040,756.07 3.16%
18 Kalimantan Barat 1,659,352,606.17 0.10% 1,765,278,536.95 0.10% 2,914,003,594.84 0.16% 1,475,261,112.44 0.13%
19 Kalimantan Tengah 2,779,654,555.53 0.16% 2,714,045,205.49 0.15% 3,576,879,669.84 0.20% 4,466,399,145.67 0.40%
20 Kalimantan Selatan 19,156,026,288.61 1.10% 22,533,052,927.72 1.26% 45,667,092,609.28 2.53% 9,924,117,363.68 0.88%
21 Kalimantan Timur 155,024,128,298.37 8.94% 129,855,254,966.87 7.24% 55,638,793,445.82 3.08% 37,012,076,395.18 3.29%
22 Sulawesi Utara 4,173,700,913.48 0.24% 5,111,502,494.62 0.29% 4,774,347,563.95 0.26% 3,383,327,151.29 0.30%
23 Sulawesi Tengah 1,006,671,453.84 0.06% 1,551,161,208.75 0.09% 1,649,386,637.62 0.09% 930,494,082.23 0.08%
24 Sulawesi Selatan 16,717,729,565.16 0.96% 23,069,679,622.97 1.29% 23,920,422,822.59 1.33% 17,210,682,393.94 1.53%
25 Sulawesi Tenggara 36,900,421,496.63 2.13% 34,438,719,842.94 1.92% 36,343,138,610.78 2.02% 551,639,022.88 0.05%
26 Gorontalo 470,108,981.96 0.03% 558,018,128.04 0.03% 545,614,739.22 0.03% 187,731,787.19 0.02%
27 Sulawesi Barat 53,058,174.52 0.00% 78,554,681.37 0.00% 113,260,749.44 0.01% 522,647,723.57 0.05%
28 Nusa Tenggara Barat 1,963,324,282.82 0.11% 3,706,010,978.81 0.21% 2,771,452,454.59 0.15% 1,764,711,010.32 0.16%
29 Nusa Tenggara Timur 660,936,009.28 0.04% 470,786,558.82 0.03% 674,419,775.98 0.04% 402,116,764.70 0.04%
30 Maluku 986,219,504.74 0.06% 528,835,496.63 0.03% 456,610,792.43 0.03% 656,160,724.83 0.06%
31 Maluku Utara 51,224,416.91 0.00% 703,643,802.96 0.04% 687,023,343.99 0.04% 319,112,721.78 0.03%
32 Papua Barat 1,039,504,431.46 0.06% 1,151,930,854.70 0.06% 1,263,102,712.88 0.07% 1,182,478,013.18 0.11%
33 Papua 12,023,130,236.97 0.69% 15,519,600,978.13 0.87% 6,238,679,518.29 0.35% 2,838,375,290.50 0.25%
1,734,388,214,883 1,792,551,104,580 1,803,593,179,507 1,126,166,056,755 T O T A L
Table 3.4
Province
NATIONAL GROSS PREMIUM INCOME BY PROVINCE
As At 31 December 2009
U/Y 2006 U/Y 2007 U/Y 2008 U/Y 2009
S t a t i s t i k A s u r a n s i G e m p a B u m i I n d o n e s i a 2 0 0 9 27 | P a g e
Table 4.1
U/Y 2005 U/Y 2006 U/Y 2007 U/Y 2008 U/Y 2009
Banda Aceh 1.1 218 300 434 479 265
Medan 1.2 4,761 2,857 2,911 3,897 2,156
Others 1.3 1,544 1,063 1,224 2,060 950
North Sumatera 1 6,523 4,220 4,569 6,436 3,371
Padang 2.1 2,933 2,018 2,707 3,514 2,265
Palembang 2.2 1,203 814 1,091 1,226 504
Others 2.3 6,011 4,989 5,585 8,652 3,678
South Sumatera 2 10,147 7,821 9,383 13,392 6,447
DKI Jakarta 3.1 22,184 22,309 24,054 24,693 15,145
Bandung 3.2 3,313 3,008 3,579 4,372 724
Others 3.3 15,017 13,098 14,198 17,722 12,658
DKI & West Java 3 40,514 38,415 41,831 46,787 28,527
Semarang 4.1 1,757 1,563 1,890 2,291 307
Yogyakarta 4.2 936 1,376 1,669 1,738 1,098
Others 4.3 3,121 2,971 3,654 5,576 3,795
DIY & Central Java 4 5,814 5,910 7,213 9,605 5,200
Surabaya 5.1 3,584 2,875 3,258 3,877 2,068
Others 5.2 4,567 3,143 3,618 5,140 2,842
East Java 5 8,151 6,018 6,876 9,017 4,910
Kalimantan 6 2,798 1,831 2,040 3,385 1,290
Ujung Pandang 7.1 1,070 759 867 1,076 546
Others 7.2 2,386 1,445 2,156 3,178 999
Sulawesi 7 3,456 2,204 3,023 4,254 1,545
Other Island 8 4,887 4,696 5,672 6,795 4,714
82,290 71,115 80,607 99,671 56,004
*) Figure above excluding undefined multi location risks
T O T A L
NUMBER OF RISKS BY CRESTA ZONE
As At 31 December 2009
CRESTA ZONE
S t a t i s t i k A s u r a n s i G e m p a B u m i I n d o n e s i a 2 0 0 9 28 | P a g e
Grafik 4.1

S t a t i s t i k A s u r a n s i G e m p a B u m i I n d o n e s i a 2 0 0 9 29 | P a g e
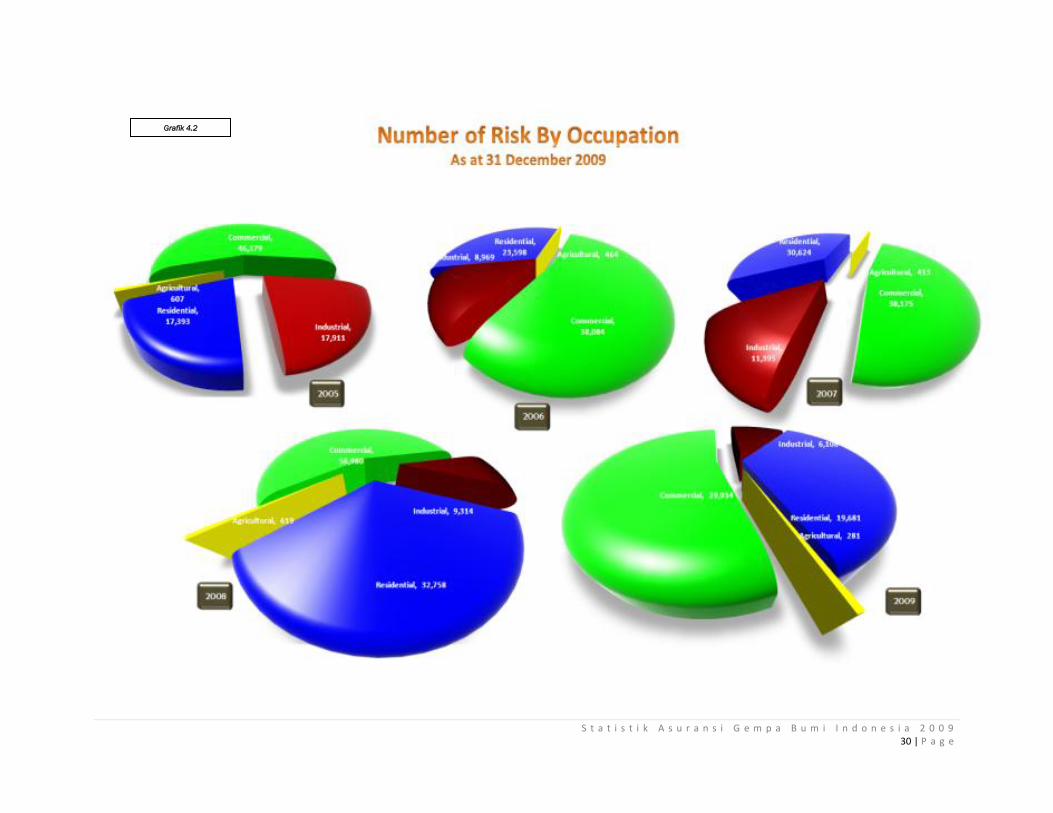
Table 4.2
In IDR
Description U/Y 2005 In % U/Y 2006 In % U/Y 2007 In % U/Y 2008 In % U/Y 2009 In %
Agricultural 607 1% 464 1% 413 1% 619 1% 281 1%
Commercial 46,379 56% 38,084 54% 38,175 47% 56,980 57% 29,934 53%
Industrial 17,911 22% 8,969 13% 11,395 14% 9,314 9% 6,108 11%
Residential 17,393 21% 23,598 33% 30,624 38% 32,758 33% 19,681 35%
TOTAL 82,290 71,115 80,607 99,671 56,004
*) Figure above excluding undefined multi location risks
NUMBER OF RISK BY OCCUPATION
As At 31 December 2009
S t a t i s t i k A s u r a n s i G e m p a B u m i I n d o n e s i a 2 0 0 9 30 | P a g e
Grafik 4.2
S t a t i s t i k A s u r a n s i G e m p a B u m i I n d o n e s i a 2 0 0 9 31 | P a g e
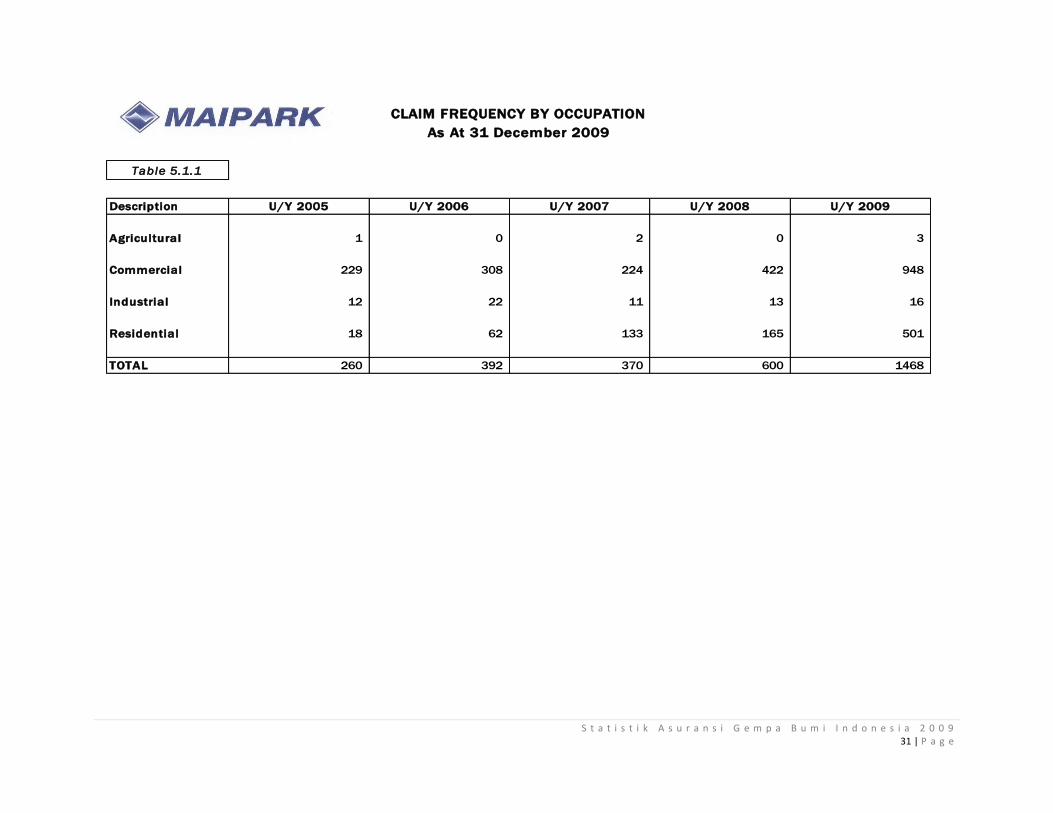
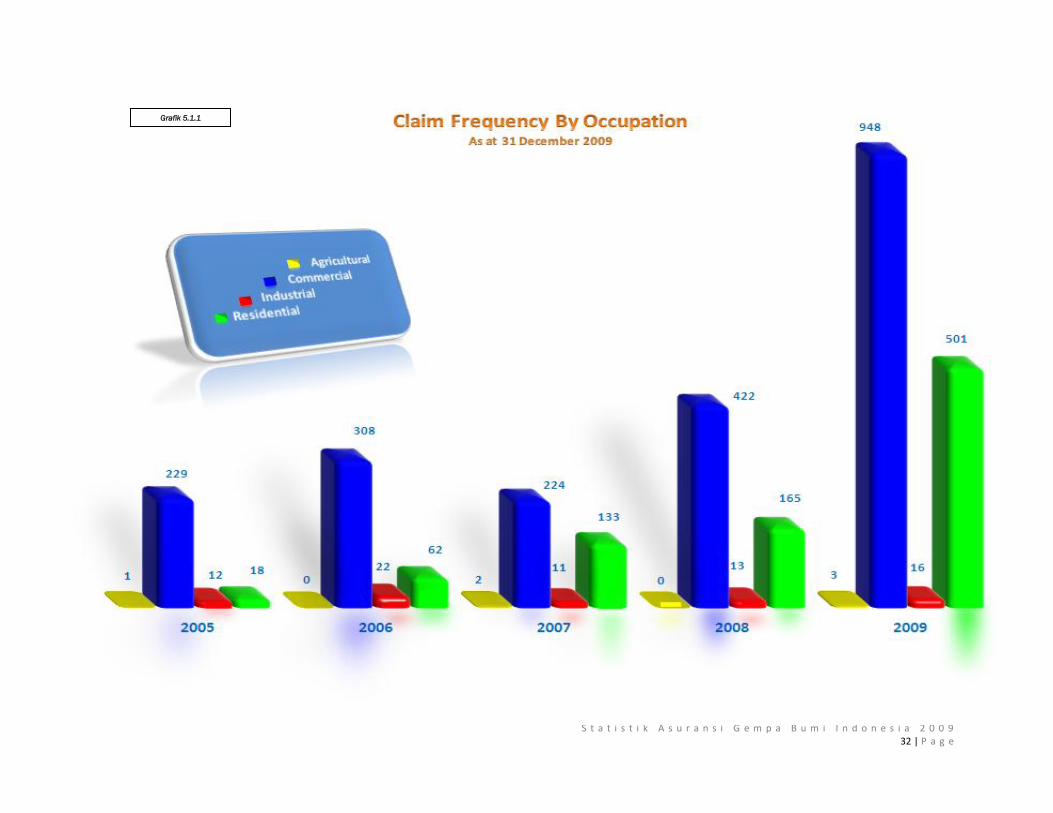
Table 5.1.1
Description U/Y 2005 U/Y 2006 U/Y 2007 U/Y 2008 U/Y 2009
Agricultural 1 0 2 0 3
Commercial 229 308 224 422 948
Industrial 12 22 11 13 16
Residential 18 62 133 165 501
TOTAL 260 392 370 600 1468
CLAIM FREQUENCY BY OCCUPATION
As At 31 December 2009
S t a t i s t i k A s u r a n s i G e m p a B u m i I n d o n e s i a 2 0 0 9 32 | P a g e
Grafik 5.1.1
S t a t i s t i k A s u r a n s i G e m p a B u m i I n d o n e s i a 2 0 0 9 33 | P a g e
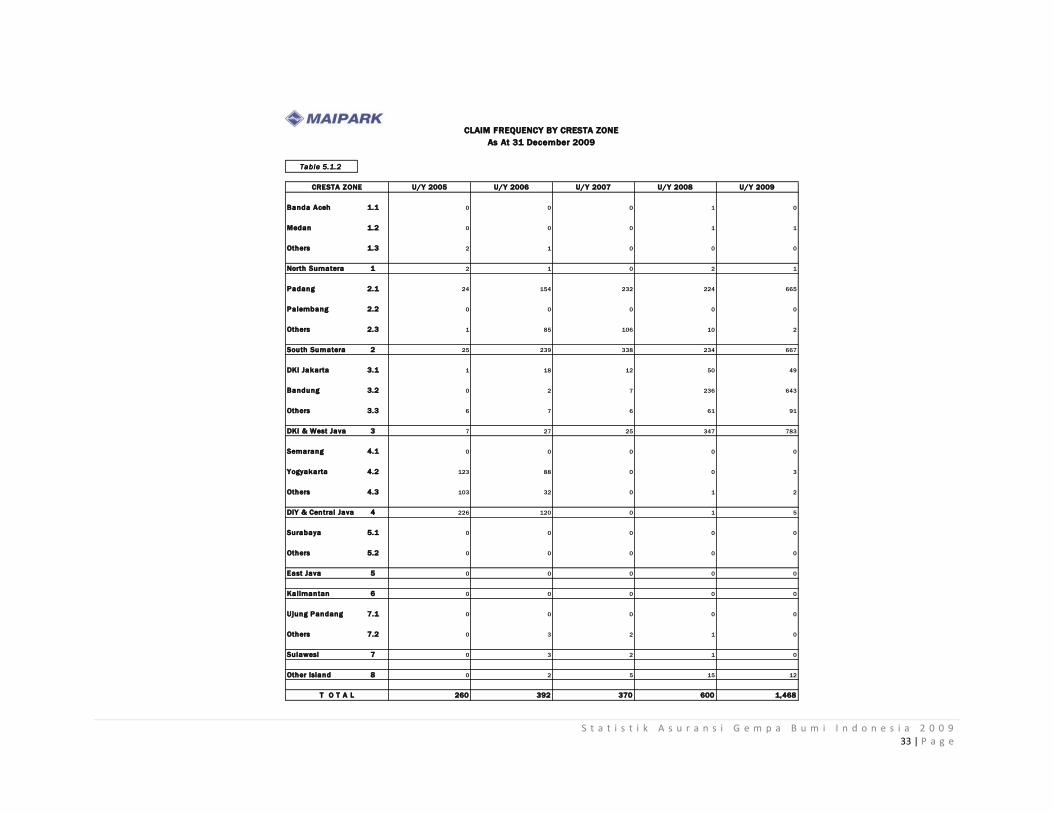
Table 5.1.2
U/Y 2005 U/Y 2006 U/Y 2007 U/Y 2008 U/Y 2009
Banda Aceh 1.1 0 0 0 1 0
Medan 1.2 0 0 0 1 1
Others 1.3 2 1 0 0 0
North Sumatera 1 2 1 0 2 1
Padang 2.1 24 154 232 224 665
Palembang 2.2 0 0 0 0 0
Others 2.3 1 85 106 10 2
South Sumatera 2 25 239 338 234 667
DKI Jakarta 3.1 1 18 12 50 49
Bandung 3.2 0 2 7 236 643
Others 3.3 6 7 6 61 91
DKI & West Java 3 7 27 25 347 783
Semarang 4.1 0 0 0 0 0
Yogyakarta 4.2 123 88 0 0 3
Others 4.3 103 32 0 1 2
DIY & Central Java 4 226 120 0 1 5
Surabaya 5.1 0 0 0 0 0
Others 5.2 0 0 0 0 0
East Java 5 0 0 0 0 0
Kalimantan 6 0 0 0 0 0
Ujung Pandang 7.1 0 0 0 0 0
Others 7.2 0 3 2 1 0
Sulawesi 7 0 3 2 1 0
Other Island 8 0 2 5 15 12
260 392 370 600 1,468
CLAIM FREQUENCY BY CRESTA ZONE
T O T A L
CRESTA ZONE
As At 31 December 2009

S t a t i s t i k A s u r a n s i G e m p a B u m i I n d o n e s i a 2 0 0 9 34 | P a g e
Grafik 5.1.2
S t a t i s t i k A s u r a n s i G e m p a B u m i I n d o n e s i a 2 0 0 9 35 | P a g e
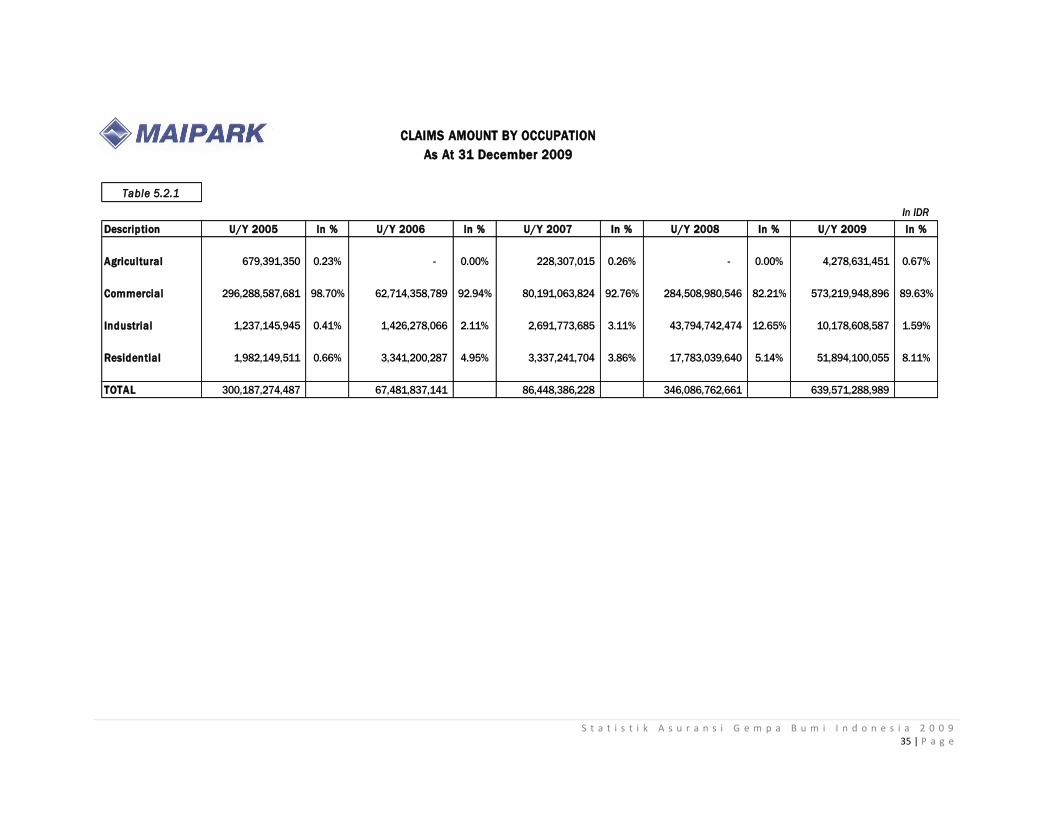
Table 5.2.1
In IDR
Description U/Y 2005 In % U/Y 2006 In % U/Y 2007 In % U/Y 2008 In % U/Y 2009 In %
Agricultural 679,391,350 0.23% - 0.00% 228,307,015 0.26% - 0.00% 4,278,631,451 0.67%
Commercial 296,288,587,681 98.70% 62,714,358,789 92.94% 80,191,063,824 92.76% 284,508,980,546 82.21% 573,219,948,896 89.63%
Industrial 1,237,145,945 0.41% 1,426,278,066 2.11% 2,691,773,685 3.11% 43,794,742,474 12.65% 10,178,608,587 1.59%
Residential 1,982,149,511 0.66% 3,341,200,287 4.95% 3,337,241,704 3.86% 17,783,039,640 5.14% 51,894,100,055 8.11%
TOTAL 300,187,274,487 67,481,837,141 86,448,386,228 346,086,762,661 639,571,288,989
CLAIMS AMOUNT BY OCCUPATION
As At 31 December 2009

S t a t i s t i k A s u r a n s i G e m p a B u m i I n d o n e s i a 2 0 0 9 36 | P a g e
Grafik 5.2.1

S t a t i s t i k A s u r a n s i G e m p a B u m i I n d o n e s i a 2 0 0 9 37 | P a g e
Table 5.2.2
In IDR
Amount in % Amount in % Amount in % Amount in % Amount in %
Banda Aceh 1.1 0.00 0.00 0.00 53,980,575.00 0.00
Medan 1.2 0.00 0.00 0.00 35,147,600.00 849,225,000.00
Others 1.3 693,471,350.00 38,868,000.00 0.00 0.00 0.00
North Sumatera 1 693,471,350.00 0.2% 38,868,000.00 0.1% 0.00 0.0% 89,128,175.00 0.0% 849,225,000.00 0.1%
Padang 2.1 520,815,384.91 12,392,323,221.48 71,975,480,730.66 121,274,954,417.79 347,743,173,179.89
Palembang 2.2 0.00 0.00 0.00 0.00 0.00
Others 2.3 28,044,000.00 13,301,235,769.69 7,256,181,339.40 382,359,613.75 438,045,436.44
South Sumatera 2 548,859,384.91 0.2% 25,693,558,991.17 38.1% 79,231,662,070.06 91.7% 121,657,314,031.54 35.2% 348,181,218,616.33 54.4%
DKI Jakarta 3.1 33,575,300.00 1,274,922,115.00 1,423,567,052.00 14,478,375,341.82 6,545,921,353.28
Bandung 3.2 0.00 29,532,220.00 3,123,678,404.89 184,466,649,426.00 188,842,309,358.76
Others 3.3 2,124,517,860.13 592,233,256.31 863,777,250.00 8,198,379,706.48 61,764,297,912.46
DKI & West Java 3 2,158,093,160.13 0.7% 1,896,687,591.31 2.8% 5,411,022,706.89 6.3% 207,143,404,474.30 59.9% 257,152,528,624.50 40.2%
Semarang 4.1 0.00 0.00 0.00 0.00 0.00
Yogyakarta 4.2 289,312,869,462.44 35,881,903,755.23 0.00 0.00 132,677,500.00
Others 4.3 7,473,981,129.57 3,689,214,185.00 0.00 25,000,000.00 77,500,000.00
DIY & Central Java 4 296,786,850,592.01 98.9% 39,571,117,940.23 58.6% 0.00 0.0% 25,000,000.00 0.0% 210,177,500.00 0.0%
Surabaya 5.1 0.00 0.00 0.00 0.00 0.00
Others 5.2 0.00 0.00 0.00 0.00 0.00
East Java 5 0.00 0.0% 0.00 0.0% 0.00 0.0% 0.00 0.0% 0.00 0.0%
Kalimantan 6 0.00 0.0% 0.00 0.0% 0.00 0.0% 0.00 0.0% 0.00 0.0%
Ujung Pandang 7.1 0.00 0.00 0.00 0.00 0.00
Others 7.2 0.00 134,523,123.14 369,371,661.00 2,800,000.00 0.00
Sulawesi 7 0.00 0.0% 134,523,123.14 0.2% 369,371,661.00 0.4% 2,800,000.00 0.0% 0.00 0.0%
Other Island 8 0.00 0.0% 147,081,495.59 0.2% 1,436,329,790.00 1.7% 17,169,115,980.13 5.0% 33,178,139,248.48 5.2%
300,187,274,487.05 67,481,837,141.44 86,448,386,227.95 346,086,762,660.97 639,571,288,989.31 T O T A L
Claims Amount By Cresta Zone
As At 31 December 2009
CRESTA ZONE U/Y 2005 U/Y 2006 U/Y 2007 U/Y 2008 U/Y 2009

S t a t i s t i k A s u r a n s i G e m p a B u m i I n d o n e s i a 2 0 0 9 38 | P a g e
Grafik 5.2.2
S t a t i s t i k A s u r a n s i G e m p a B u m i I n d o n e s i a 2 0 0 9 39 | P a g e
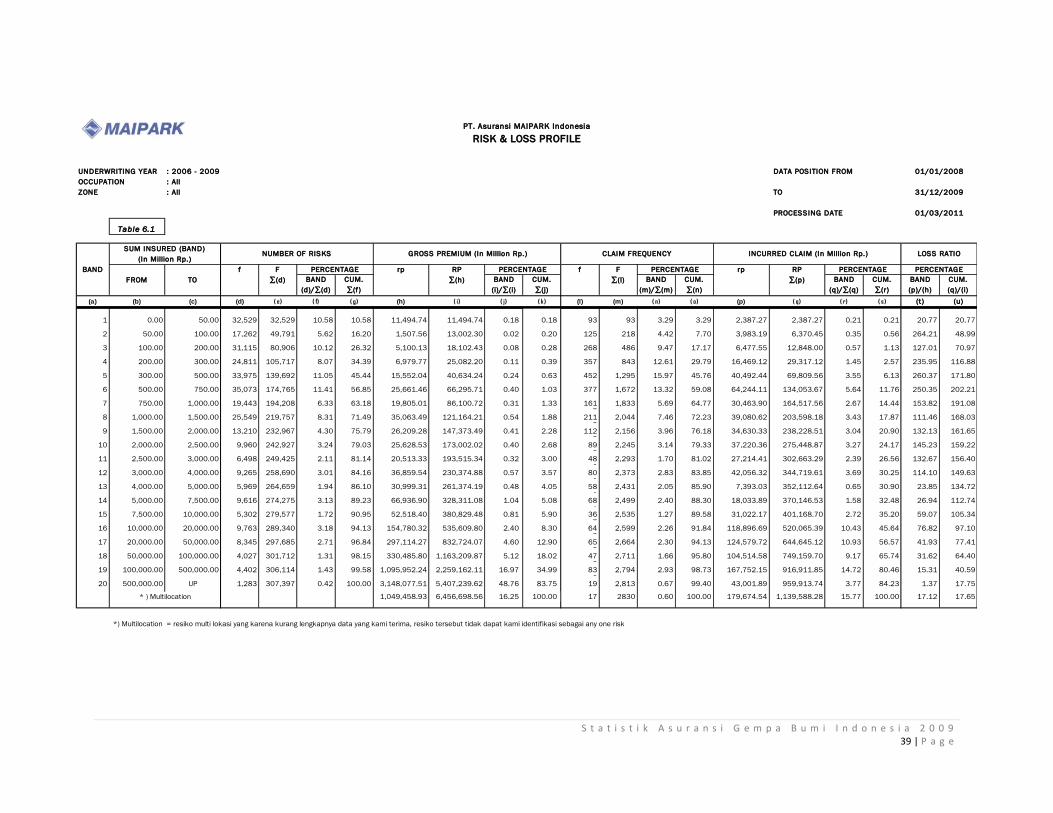
UNDERWRITING YEAR : 2006 - 2009 DATA POSITION FROM
OCCUPATION : All
ZONE : All TO
PROCESSING DATE
Table 6.1
BAND
(d)/∑(d)
CUM.
∑(f)
BAND
(i)/∑(i)
CUM.
∑(j)
BAND
(m)/∑(m)
CUM.
∑(n)
BAND
(q)/∑(q)
CUM.
∑(r)
BAND
(p)/(h)
CUM.
(q)/(i)
(a) (b) (c) (d) ( e) ( f) ( g) (h) ( i) ( j) ( k) (l) (m) ( n) ( o) (p) ( q) ( r) ( s) (t ) (u)
1 0.00 50.00 32,529 32,529 10.58 10.58 11,494.74 11,494.74 0.18 0.18 93 93 3.29 3.29 2,387.27 2,387.27 0.21 0.21 20.77 20.77
2 50.00 100.00 17,262 49,791 5.62 16.20 1,507.56 13,002.30 0.02 0.20 125 218 4.42 7.70 3,983.19 6,370.45 0.35 0.56 264.21 48.99
3 100.00 200.00 31,115 80,906 10.12 26.32 5,100.13 18,102.43 0.08 0.28 268 486 9.47 17.17 6,477.55 12,848.00 0.57 1.13 127.01 70.97
4 200.00 300.00 24,811 105,717 8.07 34.39 6,979.77 25,082.20 0.11 0.39 357 843 12.61 29.79 16,469.12 29,317.12 1.45 2.57 235.95 116.88
5 300.00 500.00 33,975 139,692 11.05 45.44 15,552.04 40,634.24 0.24 0.63 452 1,295 15.97 45.76 40,492.44 69,809.56 3.55 6.13 260.37 171.80
6 500.00 750.00 35,073 174,765 11.41 56.85 25,661.46 66,295.71 0.40 1.03 377 1,672 13.32 59.08 64,244.11 134,053.67 5.64 11.76 250.35 202.21
7 750.00 1,000.00 19,443 194,208 6.33 63.18 19,805.01 86,100.72 0.31 1.33 161 1,833 5.69 64.77 30,463.90 164,517.56 2.67 14.44 153.82 191.080
8 1,000.00 1,500.00 25,549 219,757 8.31 71.49 35,063.49 121,164.21 0.54 1.88 211 2,044 7.46 72.23 39,080.62 203,598.18 3.43 17.87 111.46 168.030
9 1,500.00 2,000.00 13,210 232,967 4.30 75.79 26,209.28 147,373.49 0.41 2.28 112 2,156 3.96 76.18 34,630.33 238,228.51 3.04 20.90 132.13 161.650
10 2,000.00 2,500.00 9,960 242,927 3.24 79.03 25,628.53 173,002.02 0.40 2.68 89 2,245 3.14 79.33 37,220.36 275,448.87 3.27 24.17 145.23 159.220
11 2,500.00 3,000.00 6,498 249,425 2.11 81.14 20,513.33 193,515.34 0.32 3.00 48 2,293 1.70 81.02 27,214.41 302,663.29 2.39 26.56 132.67 156.400
12 3,000.00 4,000.00 9,265 258,690 3.01 84.16 36,859.54 230,374.88 0.57 3.57 80 2,373 2.83 83.85 42,056.32 344,719.61 3.69 30.25 114.10 149.630
13 4,000.00 5,000.00 5,969 264,659 1.94 86.10 30,999.31 261,374.19 0.48 4.05 58 2,431 2.05 85.90 7,393.03 352,112.64 0.65 30.90 23.85 134.720
14 5,000.00 7,500.00 9,616 274,275 3.13 89.23 66,936.90 328,311.08 1.04 5.08 68 2,499 2.40 88.30 18,033.89 370,146.53 1.58 32.48 26.94 112.740
15 7,500.00 10,000.00 5,302 279,577 1.72 90.95 52,518.40 380,829.48 0.81 5.90 36 2,535 1.27 89.58 31,022.17 401,168.70 2.72 35.20 59.07 105.340
16 10,000.00 20,000.00 9,763 289,340 3.18 94.13 154,780.32 535,609.80 2.40 8.30 64 2,599 2.26 91.84 118,896.69 520,065.39 10.43 45.64 76.82 97.100
17 20,000.00 50,000.00 8,345 297,685 2.71 96.84 297,114.27 832,724.07 4.60 12.90 65 2,664 2.30 94.13 124,579.72 644,645.12 10.93 56.57 41.93 77.410
18 50,000.00 100,000.00 4,027 301,712 1.31 98.15 330,485.80 1,163,209.87 5.12 18.02 47 2,711 1.66 95.80 104,514.58 749,159.70 9.17 65.74 31.62 64.400
19 100,000.00 500,000.00 4,402 306,114 1.43 99.58 1,095,952.24 2,259,162.11 16.97 34.99 83 2,794 2.93 98.73 167,752.15 916,911.85 14.72 80.46 15.31 40.590
20 500,000.00 UP 1,283 307,397 0.42 100.00 3,148,077.51 5,407,239.62 48.76 83.75 19 2,813 0.67 99.40 43,001.89 959,913.74 3.77 84.23 1.37 17.750 0.00
1,049,458.93 6,456,698.56 16.25 100.00 17 2830 0.60 100.00 179,674.54 1,139,588.28 15.77 100.00 17.12 17.65
*) Multilocation = resiko multi lokasi yang karena kurang lengkapnya data yang kami terima, resiko tersebut tidak dapat kami identifikasi sebagai any one risk
PT. Asuransi MAIPARK Indonesia
RISK & LOSS PROFILE
CLAIM FREQUENCY LOSS RATIO
BAND f F
∑(d)
SUM INSURED (BAND)
(In Million Rp.)
rp
GROSS PREMIUM (In Million Rp.)
PERCENTAGE
NUMBER OF RISKS
f PERCENTAGE RP
∑(p)
rp
01/01/2008
FROM TO
PERCENTAGEPERCENTAGE PERCENTAGE F
∑(l)
* ) Multilocation
RP
∑(h)
INCURRED CLAIM (In Million Rp.)
31/12/2009
01/03/2011

S t a t i s t i k A s u r a n s i G e m p a B u m i I n d o n e s i a 2 0 0 9 40 | P a g e
UNDERWRITING YEAR : 2009 DATA POSITION FROM
OCCUPATION : All
ZONE : All TO
PROCESSING DATE
Table 6.2
BAND
(d)/∑(d)
CUM.
∑(f)
BAND
(i)/∑(i)
CUM.
∑(j)
BAND
(m)/∑(m)
CUM.
∑(n)
BAND
(q)/∑(q)
CUM.
∑(r)
BAND
(p)/(h)
CUM.
(q)/(i)
(a) (b) (c) (d) ( e) ( f) ( g) (h) ( i) ( j) ( k) (l) (m) ( n) ( o) (p) ( q) ( r) ( s) (t ) (u)
1 0.00 50.00 2,594 2,594 4.63 4.63 96.12 96.12 0.01 0.01 73 73 4.97 4.97 2,027.14 2,027.14 0.32 0.32 2,109.08 2,109.08
2 50.00 100.00 2,137 4,731 3.82 8.45 192.68 288.79 0.02 0.03 83 156 5.65 10.63 2,638.57 4,665.71 0.41 0.73 1,369.43 1,615.60
3 100.00 200.00 5,271 10,002 9.41 17.86 897.23 1,186.03 0.08 0.11 154 310 10.49 21.12 4,271.42 8,937.13 0.67 1.40 476.06 753.54
4 200.00 300.00 4,517 14,519 8.07 25.92 1,308.89 2,494.91 0.12 0.22 211 521 14.37 35.49 11,519.47 20,456.60 1.80 3.20 880.10 819.93
5 300.00 500.00 6,664 21,183 11.90 37.82 3,092.28 5,587.19 0.27 0.50 254 775 17.30 52.79 28,332.20 48,788.81 4.43 7.63 916.22 873.23
6 500.00 750.00 6,893 28,076 12.31 50.13 5,050.52 10,637.72 0.45 0.94 205 980 13.96 66.76 42,755.06 91,543.86 6.68 14.31 846.55 860.56
7 750.00 1,000.00 5,539 33,615 9.89 60.02 5,613.68 16,251.39 0.50 1.44 75 1,055 5.11 71.87 17,029.16 108,573.02 2.66 16.98 303.35 668.08
8 1,000.00 1,500.00 5,165 38,780 9.22 69.25 7,180.27 23,431.66 0.64 2.08 96 1,151 6.54 78.41 25,670.26 134,243.27 4.01 20.99 357.51 572.91
9 1,500.00 2,000.00 2,682 41,462 4.79 74.03 5,321.22 28,752.88 0.47 2.55 58 1,209 3.95 82.36 19,139.87 153,383.15 2.99 23.98 359.69 533.45
10 2,000.00 2,500.00 2,138 43,600 3.82 77.85 5,539.89 34,292.77 0.49 3.05 44 1,253 3.00 85.35 18,970.41 172,353.56 2.97 26.95 342.43 502.59
11 2,500.00 3,000.00 1,369 44,969 2.44 80.30 4,301.21 38,593.99 0.38 3.43 16 1,269 1.09 86.44 11,658.23 184,011.79 1.82 28.77 271.05 476.79
12 3,000.00 4,000.00 1,978 46,947 3.53 83.83 7,817.60 46,411.58 0.69 4.12 37 1,306 2.52 88.96 24,184.36 208,196.15 3.78 32.55 309.36 448.59
13 4,000.00 5,000.00 1,139 48,086 2.03 85.86 5,822.55 52,234.13 0.52 4.64 16 1,322 1.09 90.05 1,851.51 210,047.67 0.29 32.84 31.80 402.13
14 5,000.00 7,500.00 1,885 49,971 3.37 89.23 13,208.96 65,443.09 1.17 5.81 25 1,347 1.70 91.76 6,548.03 216,595.69 1.02 33.87 49.57 330.97
15 7,500.00 10,000.00 918 50,889 1.64 90.87 9,117.85 74,560.94 0.81 6.62 11 1,358 0.75 92.51 14,777.30 231,372.99 2.31 36.18 162.07 310.31
16 10,000.00 20,000.00 1,896 52,785 3.39 94.25 30,173.85 104,734.79 2.68 9.30 26 1,384 1.77 94.28 65,003.23 296,376.22 10.16 46.34 215.43 282.98
17 20,000.00 50,000.00 1,542 54,327 2.75 97.01 54,528.16 159,262.94 4.84 14.14 26 1,410 1.77 96.05 106,158.38 402,534.61 16.60 62.94 194.69 252.75
18 50,000.00 100,000.00 666 54,993 1.19 98.19 53,490.92 212,753.86 4.75 18.89 10 1,420 0.68 96.73 951.00 403,485.61 0.15 63.09 1.78 189.65
19 100,000.00 500,000.00 766 55,759 1.37 99.56 192,977.48 405,731.34 17.14 36.03 36 1,456 2.45 99.18 144,705.17 548,190.78 22.63 85.71 74.99 135.11
20 500,000.00 UP 245 56,004 0.44 100.00 564,178.41 969,909.74 50.10 86.12 3 1,459 0.20 99.39 157.50 548,348.28 0.02 85.74 0.03 56.54
156,256.31 1,126,166.06 13.88 100.00 9 1468 0.61 100.00 91,223.01 639,571.29 14.26 100.00 58.38 56.79
*) Multilocation = resiko multi lokasi yang karena kurang lengkapnya data yang kami terima, resiko tersebut tidak dapat kami identifikasi sebagai any one risk
01/01/2009
* ) Multilocation
FROM TO
PERCENTAGEPERCENTAGE PERCENTAGE F
∑(l)
RP
∑(h)
INCURRED CLAIM (In Million Rp.)
31/12/2009
01/03/2011
PT. Asuransi MAIPARK Indonesia
RISK & LOSS PROFILE
CLAIM FREQUENCY LOSS RATIO
BAND f F
∑(d)
rp
GROSS PREMIUM (In Million Rp.)
PERCENTAGE
NUMBER OF RISKS
f PERCENTAGE RP
∑(p)
SUM INSURED (BAND)
(In Million Rp.)
rp
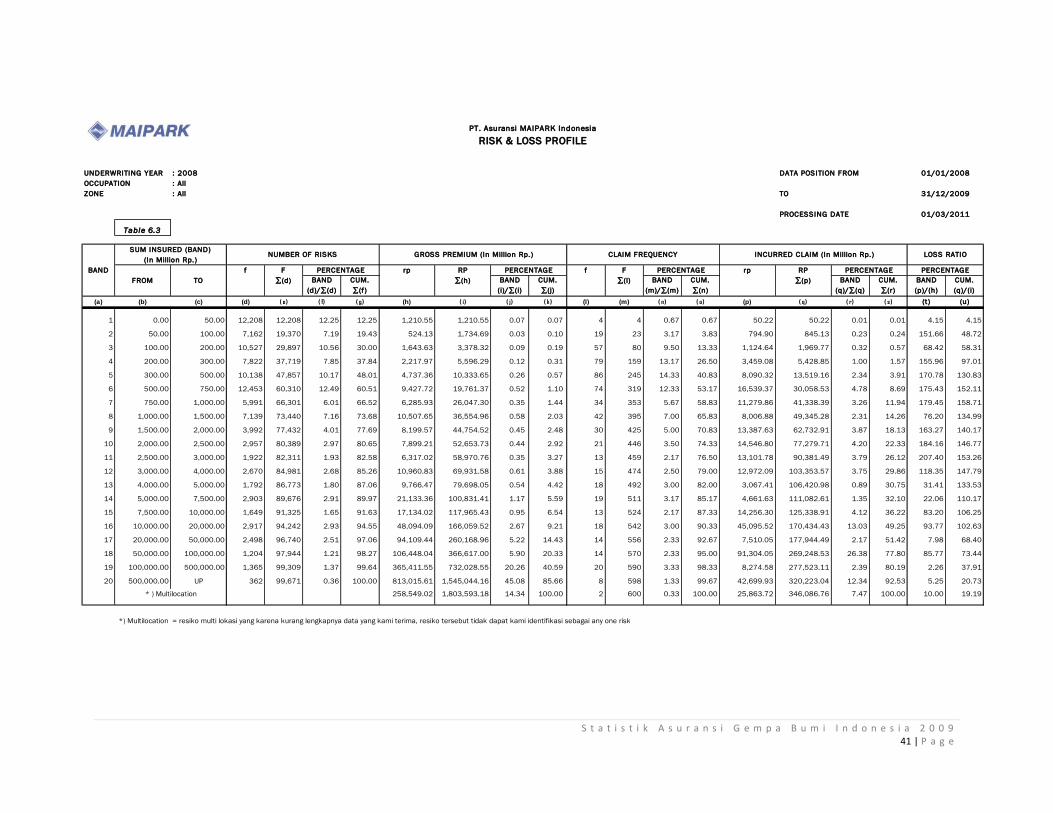
S t a t i s t i k A s u r a n s i G e m p a B u m i I n d o n e s i a 2 0 0 9 41 | P a g e
UNDERWRITING YEAR : 2008 DATA POSITION FROM
OCCUPATION : All
ZONE : All TO
PROCESSING DATE
Table 6.3
BAND
(d)/∑(d)
CUM.
∑(f)
BAND
(i)/∑(i)
CUM.
∑(j)
BAND
(m)/∑(m)
CUM.
∑(n)
BAND
(q)/∑(q)
CUM.
∑(r)
BAND
(p)/(h)
CUM.
(q)/(i)
(a) (b) (c) (d) ( e) ( f) ( g) (h) ( i) ( j) ( k) (l) (m) ( n) ( o) (p) ( q) ( r) ( s) (t ) (u)
1 0.00 50.00 12,208 12,208 12.25 12.25 1,210.55 1,210.55 0.07 0.07 4 4 0.67 0.67 50.22 50.22 0.01 0.01 4.15 4.15
2 50.00 100.00 7,162 19,370 7.19 19.43 524.13 1,734.69 0.03 0.10 19 23 3.17 3.83 794.90 845.13 0.23 0.24 151.66 48.72
3 100.00 200.00 10,527 29,897 10.56 30.00 1,643.63 3,378.32 0.09 0.19 57 80 9.50 13.33 1,124.64 1,969.77 0.32 0.57 68.42 58.31
4 200.00 300.00 7,822 37,719 7.85 37.84 2,217.97 5,596.29 0.12 0.31 79 159 13.17 26.50 3,459.08 5,428.85 1.00 1.57 155.96 97.01
5 300.00 500.00 10,138 47,857 10.17 48.01 4,737.36 10,333.65 0.26 0.57 86 245 14.33 40.83 8,090.32 13,519.16 2.34 3.91 170.78 130.83
6 500.00 750.00 12,453 60,310 12.49 60.51 9,427.72 19,761.37 0.52 1.10 74 319 12.33 53.17 16,539.37 30,058.53 4.78 8.69 175.43 152.11
7 750.00 1,000.00 5,991 66,301 6.01 66.52 6,285.93 26,047.30 0.35 1.44 34 353 5.67 58.83 11,279.86 41,338.39 3.26 11.94 179.45 158.71
8 1,000.00 1,500.00 7,139 73,440 7.16 73.68 10,507.65 36,554.96 0.58 2.03 42 395 7.00 65.83 8,006.88 49,345.28 2.31 14.26 76.20 134.99
9 1,500.00 2,000.00 3,992 77,432 4.01 77.69 8,199.57 44,754.52 0.45 2.48 30 425 5.00 70.83 13,387.63 62,732.91 3.87 18.13 163.27 140.17
10 2,000.00 2,500.00 2,957 80,389 2.97 80.65 7,899.21 52,653.73 0.44 2.92 21 446 3.50 74.33 14,546.80 77,279.71 4.20 22.33 184.16 146.77
11 2,500.00 3,000.00 1,922 82,311 1.93 82.58 6,317.02 58,970.76 0.35 3.27 13 459 2.17 76.50 13,101.78 90,381.49 3.79 26.12 207.40 153.26
12 3,000.00 4,000.00 2,670 84,981 2.68 85.26 10,960.83 69,931.58 0.61 3.88 15 474 2.50 79.00 12,972.09 103,353.57 3.75 29.86 118.35 147.79
13 4,000.00 5,000.00 1,792 86,773 1.80 87.06 9,766.47 79,698.05 0.54 4.42 18 492 3.00 82.00 3,067.41 106,420.98 0.89 30.75 31.41 133.53
14 5,000.00 7,500.00 2,903 89,676 2.91 89.97 21,133.36 100,831.41 1.17 5.59 19 511 3.17 85.17 4,661.63 111,082.61 1.35 32.10 22.06 110.17
15 7,500.00 10,000.00 1,649 91,325 1.65 91.63 17,134.02 117,965.43 0.95 6.54 13 524 2.17 87.33 14,256.30 125,338.91 4.12 36.22 83.20 106.25
16 10,000.00 20,000.00 2,917 94,242 2.93 94.55 48,094.09 166,059.52 2.67 9.21 18 542 3.00 90.33 45,095.52 170,434.43 13.03 49.25 93.77 102.63
17 20,000.00 50,000.00 2,498 96,740 2.51 97.06 94,109.44 260,168.96 5.22 14.43 14 556 2.33 92.67 7,510.05 177,944.49 2.17 51.42 7.98 68.40
18 50,000.00 100,000.00 1,204 97,944 1.21 98.27 106,448.04 366,617.00 5.90 20.33 14 570 2.33 95.00 91,304.05 269,248.53 26.38 77.80 85.77 73.44
19 100,000.00 500,000.00 1,365 99,309 1.37 99.64 365,411.55 732,028.55 20.26 40.59 20 590 3.33 98.33 8,274.58 277,523.11 2.39 80.19 2.26 37.91
20 500,000.00 UP 362 99,671 0.36 100.00 813,015.61 1,545,044.16 45.08 85.66 8 598 1.33 99.67 42,699.93 320,223.04 12.34 92.53 5.25 20.73
258,549.02 1,803,593.18 14.34 100.00 2 600 0.33 100.00 25,863.72 346,086.76 7.47 100.00 10.00 19.19
*) Multilocation = resiko multi lokasi yang karena kurang lengkapnya data yang kami terima, resiko tersebut tidak dapat kami identifikasi sebagai any one risk
PT. Asuransi MAIPARK Indonesia
RISK & LOSS PROFILE
CLAIM FREQUENCY LOSS RATIO
BAND f F
∑(d)
SUM INSURED (BAND)
(In Million Rp.)
rp
GROSS PREMIUM (In Million Rp.)
PERCENTAGE
NUMBER OF RISKS
f PERCENTAGE RP
∑(p)
rp
INCURRED CLAIM (In Million Rp.)
31/12/2009
01/03/2011
01/01/2008
* ) Multilocation
FROM TO
PERCENTAGEPERCENTAGE PERCENTAGE F
∑(l)
RP
∑(h)

S t a t i s t i k A s u r a n s i G e m p a B u m i I n d o n e s i a 2 0 0 9 42 | P a g e
UNDERWRITING YEAR : 2007 DATA POSITION FROM
OCCUPATION : All
ZONE : All TO
PROCESSING DATE
Table 6.4
BAND
(d)/∑(d)
CUM.
∑(f)
BAND
(i)/∑(i)
CUM.
∑(j)
BAND
(m)/∑(m)
CUM.
∑(n)
BAND
(q)/∑(q)
CUM.
∑(r)
BAND
(p)/(h)
CUM.
(q)/(i)
(a) (b) (c) (d) ( e) ( f) ( g) (h) ( i) ( j) ( k) (l) (m) ( n) ( o) (p) ( q) ( r) ( s) (t ) (u)
1 0.00 50.00 6,915 6,915 8.58 8.58 239.07 239.07 0.01 0.01 3 3 0.81 0.81 62.89 62.89 0.07 0.07 26.31 26.31
2 50.00 100.00 4,063 10,978 5.04 13.62 429.58 668.65 0.02 0.04 6 9 1.62 2.43 156.13 219.02 0.18 0.25 36.34 32.76
3 100.00 200.00 8,513 19,491 10.56 24.18 1,457.01 2,125.66 0.08 0.12 24 33 6.49 8.92 378.06 597.08 0.44 0.69 25.95 28.09
4 200.00 300.00 6,780 26,271 8.41 32.59 1,918.55 4,044.20 0.11 0.23 37 70 10.00 18.92 732.24 1,329.32 0.85 1.54 38.17 32.87
5 300.00 500.00 9,274 35,545 11.51 44.10 4,250.88 8,295.09 0.24 0.46 63 133 17.03 35.95 1,937.24 3,266.56 2.24 3.78 45.57 39.38
6 500.00 750.00 8,780 44,325 10.89 54.99 6,431.17 14,726.26 0.36 0.82 53 186 14.32 50.27 2,244.82 5,511.38 2.60 6.38 34.91 37.43
7 750.00 1,000.00 4,467 48,792 5.54 60.53 4,594.66 19,320.92 0.26 1.08 24 210 6.49 56.76 648.59 6,159.97 0.75 7.13 14.12 31.88
8 1,000.00 1,500.00 7,790 56,582 9.66 70.19 10,193.08 29,514.00 0.57 1.65 40 250 10.81 67.57 2,257.91 8,417.87 2.61 9.74 22.15 28.52
9 1,500.00 2,000.00 3,664 60,246 4.55 74.74 7,335.24 36,849.24 0.41 2.06 14 264 3.78 71.35 1,424.86 9,842.73 1.65 11.39 19.42 26.71
10 2,000.00 2,500.00 2,704 62,950 3.35 78.09 6,977.26 43,826.50 0.39 2.44 12 276 3.24 74.59 908.58 10,751.31 1.05 12.44 13.02 24.53
11 2,500.00 3,000.00 1,769 64,719 2.19 80.29 5,661.30 49,487.80 0.32 2.76 10 286 2.70 77.30 1,247.97 11,999.28 1.44 13.88 22.04 24.25
12 3,000.00 4,000.00 2,490 67,209 3.09 83.38 10,138.81 59,626.61 0.57 3.33 13 299 3.51 80.81 3,123.33 15,122.61 3.61 17.49 30.81 25.36
13 4,000.00 5,000.00 1,643 68,852 2.04 85.42 8,632.34 68,258.95 0.48 3.81 9 308 2.43 83.24 759.92 15,882.53 0.88 18.37 8.80 23.27
14 5,000.00 7,500.00 2,626 71,478 3.26 88.67 18,351.90 86,610.85 1.02 4.83 13 321 3.51 86.76 1,743.24 17,625.77 2.02 20.39 9.50 20.35
15 7,500.00 10,000.00 1,565 73,043 1.94 90.62 15,532.39 102,143.24 0.87 5.70 1 322 0.27 87.03 37.93 17,663.70 0.04 20.43 0.24 17.29
16 10,000.00 20,000.00 2,574 75,617 3.19 93.81 41,826.56 143,969.79 2.33 8.03 9 331 2.43 89.46 2,273.52 19,937.22 2.63 23.06 5.44 13.85
17 20,000.00 50,000.00 2,309 77,926 2.86 96.67 82,900.92 226,870.72 4.62 12.66 13 344 3.51 92.97 6,592.94 26,530.16 7.63 30.69 7.95 11.69
18 50,000.00 100,000.00 1,178 79,104 1.46 98.14 97,172.85 324,043.56 5.42 18.08 9 353 2.43 95.41 4,892.99 31,423.15 5.66 36.35 5.04 9.70
19 100,000.00 500,000.00 1,178 80,282 1.46 99.60 295,508.56 619,552.12 16.49 34.56 13 366 3.51 98.92 4,806.45 36,229.60 5.56 41.91 1.63 5.85
20 500,000.00 UP 325 80,607 0.40 100.00 856,233.94 1,475,786.07 47.77 82.33 1 367 0.27 99.19 1.39 36,230.99 0.00 41.91 0.00 2.46
316,765.04 1,792,551.10 17.67 100.00 3 370 0.81 100.00 50,217.39 86,448.39 58.09 100.00 15.85 4.82
*) Multilocation = resiko multi lokasi yang karena kurang lengkapnya data yang kami terima, resiko tersebut tidak dapat kami identifikasi sebagai any one risk
INCURRED CLAIM (In Million Rp.)
31/12/2009
01/03/2011
01/01/2007
* ) Multilocation
FROM TO
PERCENTAGEPERCENTAGE PERCENTAGE F
∑(l)
RP
∑(h)
PT. Asuransi MAIPARK Indonesia
RISK & LOSS PROFILE
CLAIM FREQUENCY LOSS RATIO
BAND f F
∑(d)
SUM INSURED (BAND)
(In Million Rp.)
rp
GROSS PREMIUM (In Million Rp.)
PERCENTAGE
NUMBER OF RISKS
f PERCENTAGE RP
∑(p)
rp
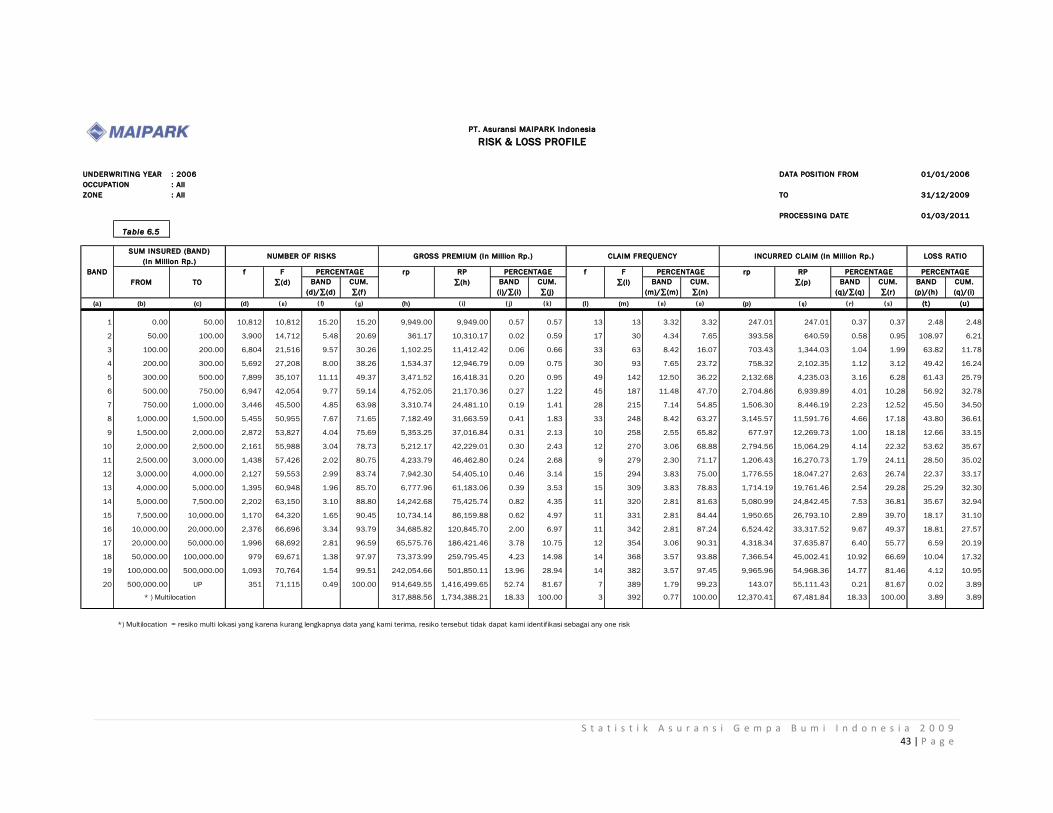
S t a t i s t i k A s u r a n s i G e m p a B u m i I n d o n e s i a 2 0 0 9 43 | P a g e
UNDERWRITING YEAR : 2006 DATA POSITION FROM
OCCUPATION : All
ZONE : All TO
PROCESSING DATE
Table 6.5
BAND
(d)/∑(d)
CUM.
∑(f)
BAND
(i)/∑(i)
CUM.
∑(j)
BAND
(m)/∑(m)
CUM.
∑(n)
BAND
(q)/∑(q)
CUM.
∑(r)
BAND
(p)/(h)
CUM.
(q)/(i)
(a) (b) (c) (d) ( e) ( f) ( g) (h) ( i) ( j) ( k) (l) (m) ( n) ( o) (p) ( q) ( r) ( s) (t ) (u)
1 0.00 50.00 10,812 10,812 15.20 15.20 9,949.00 9,949.00 0.57 0.57 13 13 3.32 3.32 247.01 247.01 0.37 0.37 2.48 2.48
2 50.00 100.00 3,900 14,712 5.48 20.69 361.17 10,310.17 0.02 0.59 17 30 4.34 7.65 393.58 640.59 0.58 0.95 108.97 6.21
3 100.00 200.00 6,804 21,516 9.57 30.26 1,102.25 11,412.42 0.06 0.66 33 63 8.42 16.07 703.43 1,344.03 1.04 1.99 63.82 11.78
4 200.00 300.00 5,692 27,208 8.00 38.26 1,534.37 12,946.79 0.09 0.75 30 93 7.65 23.72 758.32 2,102.35 1.12 3.12 49.42 16.24
5 300.00 500.00 7,899 35,107 11.11 49.37 3,471.52 16,418.31 0.20 0.95 49 142 12.50 36.22 2,132.68 4,235.03 3.16 6.28 61.43 25.79
6 500.00 750.00 6,947 42,054 9.77 59.14 4,752.05 21,170.36 0.27 1.22 45 187 11.48 47.70 2,704.86 6,939.89 4.01 10.28 56.92 32.78
7 750.00 1,000.00 3,446 45,500 4.85 63.98 3,310.74 24,481.10 0.19 1.41 28 215 7.14 54.85 1,506.30 8,446.19 2.23 12.52 45.50 34.50
8 1,000.00 1,500.00 5,455 50,955 7.67 71.65 7,182.49 31,663.59 0.41 1.83 33 248 8.42 63.27 3,145.57 11,591.76 4.66 17.18 43.80 36.61
9 1,500.00 2,000.00 2,872 53,827 4.04 75.69 5,353.25 37,016.84 0.31 2.13 10 258 2.55 65.82 677.97 12,269.73 1.00 18.18 12.66 33.15
10 2,000.00 2,500.00 2,161 55,988 3.04 78.73 5,212.17 42,229.01 0.30 2.43 12 270 3.06 68.88 2,794.56 15,064.29 4.14 22.32 53.62 35.67
11 2,500.00 3,000.00 1,438 57,426 2.02 80.75 4,233.79 46,462.80 0.24 2.68 9 279 2.30 71.17 1,206.43 16,270.73 1.79 24.11 28.50 35.02
12 3,000.00 4,000.00 2,127 59,553 2.99 83.74 7,942.30 54,405.10 0.46 3.14 15 294 3.83 75.00 1,776.55 18,047.27 2.63 26.74 22.37 33.17
13 4,000.00 5,000.00 1,395 60,948 1.96 85.70 6,777.96 61,183.06 0.39 3.53 15 309 3.83 78.83 1,714.19 19,761.46 2.54 29.28 25.29 32.30
14 5,000.00 7,500.00 2,202 63,150 3.10 88.80 14,242.68 75,425.74 0.82 4.35 11 320 2.81 81.63 5,080.99 24,842.45 7.53 36.81 35.67 32.94
15 7,500.00 10,000.00 1,170 64,320 1.65 90.45 10,734.14 86,159.88 0.62 4.97 11 331 2.81 84.44 1,950.65 26,793.10 2.89 39.70 18.17 31.10
16 10,000.00 20,000.00 2,376 66,696 3.34 93.79 34,685.82 120,845.70 2.00 6.97 11 342 2.81 87.24 6,524.42 33,317.52 9.67 49.37 18.81 27.57
17 20,000.00 50,000.00 1,996 68,692 2.81 96.59 65,575.76 186,421.46 3.78 10.75 12 354 3.06 90.31 4,318.34 37,635.87 6.40 55.77 6.59 20.19
18 50,000.00 100,000.00 979 69,671 1.38 97.97 73,373.99 259,795.45 4.23 14.98 14 368 3.57 93.88 7,366.54 45,002.41 10.92 66.69 10.04 17.32
19 100,000.00 500,000.00 1,093 70,764 1.54 99.51 242,054.66 501,850.11 13.96 28.94 14 382 3.57 97.45 9,965.96 54,968.36 14.77 81.46 4.12 10.95
20 500,000.00 UP 351 71,115 0.49 100.00 914,649.55 1,416,499.65 52.74 81.67 7 389 1.79 99.23 143.07 55,111.43 0.21 81.67 0.02 3.89
317,888.56 1,734,388.21 18.33 100.00 3 392 0.77 100.00 12,370.41 67,481.84 18.33 100.00 3.89 3.89
*) Multilocation = resiko multi lokasi yang karena kurang lengkapnya data yang kami terima, resiko tersebut tidak dapat kami identifikasi sebagai any one risk
INCURRED CLAIM (In Million Rp.)
31/12/2009
01/03/2011
01/01/2006
* ) Multilocation
FROM TO
PERCENTAGEPERCENTAGE PERCENTAGE F
∑(l)
RP
∑(h)
PT. Asuransi MAIPARK Indonesia
RISK & LOSS PROFILE
CLAIM FREQUENCY LOSS RATIO
BAND f F
∑(d)
SUM INSURED (BAND)
(In Million Rp.)
rp
GROSS PREMIUM (In Million Rp.)
PERCENTAGE
NUMBER OF RISKS
f PERCENTAGE RP
∑(p)
rp
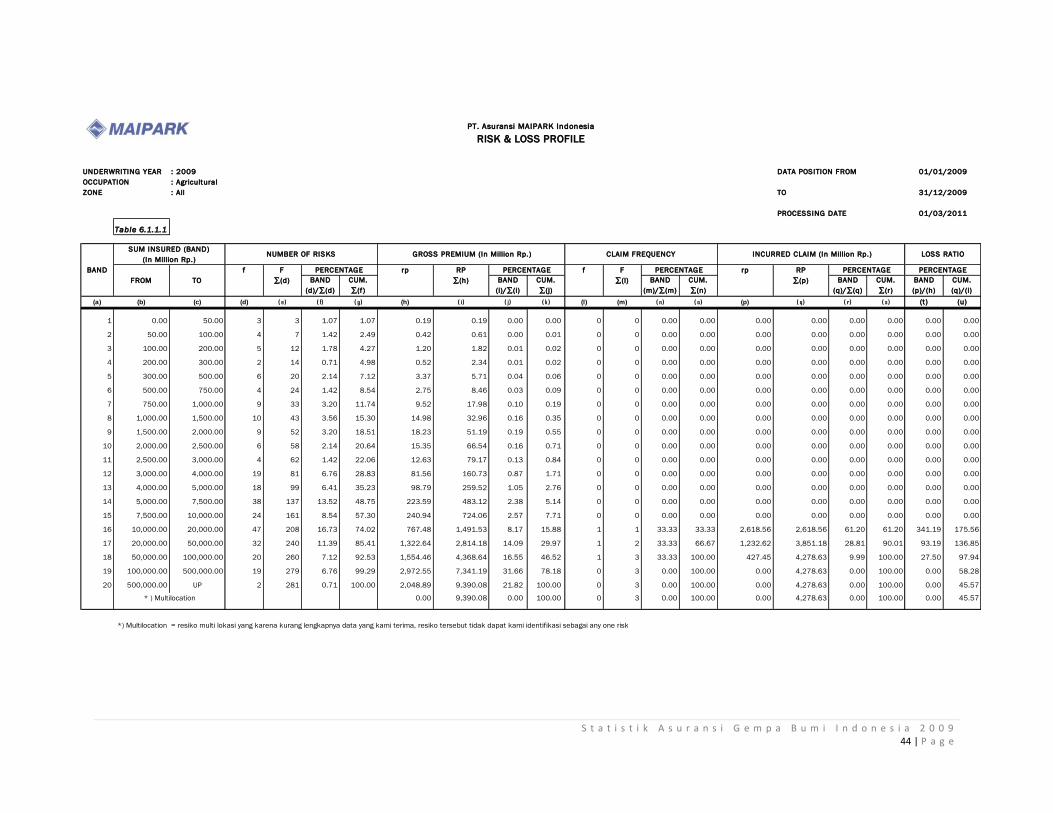
S t a t i s t i k A s u r a n s i G e m p a B u m i I n d o n e s i a 2 0 0 9 44 | P a g e
UNDERWRITING YEAR : 2009 DATA POSITION FROM
OCCUPATION : Agricultural
ZONE : All TO
PROCESSING DATE
Table 6.1.1.1
BAND
(d)/∑(d)
CUM.
∑(f)
BAND
(i)/∑(i)
CUM.
∑(j)
BAND
(m)/∑(m)
CUM.
∑(n)
BAND
(q)/∑(q)
CUM.
∑(r)
BAND
(p)/(h)
CUM.
(q)/(i)
(a) (b) (c) (d) ( e) ( f) ( g) (h) ( i) ( j) ( k) (l) (m) ( n) ( o) (p) ( q) ( r) ( s) (t ) (u)
1 0.00 50.00 3 3 1.07 1.07 0.19 0.19 0.00 0.00 0 0 0.00 0.00 0.00 0.00 0.00 0.00 0.00 0.00
2 50.00 100.00 4 7 1.42 2.49 0.42 0.61 0.00 0.01 0 0 0.00 0.00 0.00 0.00 0.00 0.00 0.00 0.00
3 100.00 200.00 5 12 1.78 4.27 1.20 1.82 0.01 0.02 0 0 0.00 0.00 0.00 0.00 0.00 0.00 0.00 0.00
4 200.00 300.00 2 14 0.71 4.98 0.52 2.34 0.01 0.02 0 0 0.00 0.00 0.00 0.00 0.00 0.00 0.00 0.00
5 300.00 500.00 6 20 2.14 7.12 3.37 5.71 0.04 0.06 0 0 0.00 0.00 0.00 0.00 0.00 0.00 0.00 0.00
6 500.00 750.00 4 24 1.42 8.54 2.75 8.46 0.03 0.09 0 0 0.00 0.00 0.00 0.00 0.00 0.00 0.00 0.00
7 750.00 1,000.00 9 33 3.20 11.74 9.52 17.98 0.10 0.19 0 0 0.00 0.00 0.00 0.00 0.00 0.00 0.00 0.00
8 1,000.00 1,500.00 10 43 3.56 15.30 14.98 32.96 0.16 0.35 0 0 0.00 0.00 0.00 0.00 0.00 0.00 0.00 0.00
9 1,500.00 2,000.00 9 52 3.20 18.51 18.23 51.19 0.19 0.55 0 0 0.00 0.00 0.00 0.00 0.00 0.00 0.00 0.00
10 2,000.00 2,500.00 6 58 2.14 20.64 15.35 66.54 0.16 0.71 0 0 0.00 0.00 0.00 0.00 0.00 0.00 0.00 0.00
11 2,500.00 3,000.00 4 62 1.42 22.06 12.63 79.17 0.13 0.84 0 0 0.00 0.00 0.00 0.00 0.00 0.00 0.00 0.00
12 3,000.00 4,000.00 19 81 6.76 28.83 81.56 160.73 0.87 1.71 0 0 0.00 0.00 0.00 0.00 0.00 0.00 0.00 0.00
13 4,000.00 5,000.00 18 99 6.41 35.23 98.79 259.52 1.05 2.76 0 0 0.00 0.00 0.00 0.00 0.00 0.00 0.00 0.00
14 5,000.00 7,500.00 38 137 13.52 48.75 223.59 483.12 2.38 5.14 0 0 0.00 0.00 0.00 0.00 0.00 0.00 0.00 0.00
15 7,500.00 10,000.00 24 161 8.54 57.30 240.94 724.06 2.57 7.71 0 0 0.00 0.00 0.00 0.00 0.00 0.00 0.00 0.00
16 10,000.00 20,000.00 47 208 16.73 74.02 767.48 1,491.53 8.17 15.88 1 1 33.33 33.33 2,618.56 2,618.56 61.20 61.20 341.19 175.56
17 20,000.00 50,000.00 32 240 11.39 85.41 1,322.64 2,814.18 14.09 29.97 1 2 33.33 66.67 1,232.62 3,851.18 28.81 90.01 93.19 136.85
18 50,000.00 100,000.00 20 260 7.12 92.53 1,554.46 4,368.64 16.55 46.52 1 3 33.33 100.00 427.45 4,278.63 9.99 100.00 27.50 97.94
19 100,000.00 500,000.00 19 279 6.76 99.29 2,972.55 7,341.19 31.66 78.18 0 3 0.00 100.00 0.00 4,278.63 0.00 100.00 0.00 58.28
20 500,000.00 UP 2 281 0.71 100.00 2,048.89 9,390.08 21.82 100.00 0 3 0.00 100.00 0.00 4,278.63 0.00 100.00 0.00 45.57
0.00 9,390.08 0.00 100.00 0 3 0.00 100.00 0.00 4,278.63 0.00 100.00 0.00 45.57
*) Multilocation = resiko multi lokasi yang karena kurang lengkapnya data yang kami terima, resiko tersebut tidak dapat kami identifikasi sebagai any one risk
PT. Asuransi MAIPARK Indonesia
RISK & LOSS PROFILE
CLAIM FREQUENCY LOSS RATIO
BAND f F
∑(d)
SUM INSURED (BAND)
(In Million Rp.)
rp
GROSS PREMIUM (In Million Rp.)
PERCENTAGE
NUMBER OF RISKS
f PERCENTAGE RP
∑(p)
rp
31/12/2009
01/03/2011
01/01/2009
* ) Multilocation
FROM TO
PERCENTAGEPERCENTAGE PERCENTAGE F
∑(l)
RP
∑(h)
INCURRED CLAIM (In Million Rp.)

S t a t i s t i k A s u r a n s i G e m p a B u m i I n d o n e s i a 2 0 0 9 45 | P a g e
UNDERWRITING YEAR : 2009 DATA POSITION FROM
OCCUPATION : Commercial
ZONE : All TO
PROCESSING DATE
Table 6.1.2.1
BAND
(d)/∑(d)
CUM.
∑(f)
BAND
(i)/∑(i)
CUM.
∑(j)
BAND
(m)/∑(m)
CUM.
∑(n)
BAND
(q)/∑(q)
CUM.
∑(r)
BAND
(p)/(h)
CUM.
(q)/(i)
(a) (b) (c) (d) ( e) ( f) ( g) (h) ( i) ( j) ( k) (l) (m) ( n) ( o) (p) ( q) ( r) ( s) (t ) (u)
1 0.00 50.00 1,646 1,646 5.50 5.50 61.97 61.97 0.03 0.03 61 61 6.43 6.43 1,839.91 1,839.91 0.32 0.32 2,968.91 2,968.91
2 50.00 100.00 1,023 2,669 3.42 8.92 87.85 149.82 0.04 0.06 50 111 5.27 11.71 1,944.69 3,784.60 0.34 0.66 2,213.78 2,526.14
3 100.00 200.00 2,650 5,319 8.85 17.77 441.07 590.89 0.18 0.24 67 178 7.07 18.78 2,282.32 6,066.92 0.40 1.06 517.45 1,026.74
4 200.00 300.00 1,913 7,232 6.39 24.16 567.66 1,158.55 0.23 0.47 90 268 9.49 28.27 6,298.09 12,365.02 1.10 2.16 1,109.48 1,067.28
5 300.00 500.00 3,147 10,379 10.51 34.67 1,518.57 2,677.12 0.62 1.10 146 414 15.40 43.67 18,855.50 31,220.52 3.29 5.45 1,241.66 1,166.20
6 500.00 750.00 3,749 14,128 12.52 47.20 2,775.59 5,452.71 1.14 2.23 129 543 13.61 57.28 29,776.12 60,996.64 5.19 10.64 1,072.78 1,118.65
7 750.00 1,000.00 4,004 18,132 13.38 60.57 4,021.26 9,473.98 1.64 3.88 54 597 5.70 62.97 13,287.30 74,283.94 2.32 12.96 330.43 784.08
8 1,000.00 1,500.00 2,946 21,078 9.84 70.41 4,067.19 13,541.17 1.66 5.54 75 672 7.91 70.89 21,964.98 96,248.92 3.83 16.79 540.05 710.79
9 1,500.00 2,000.00 1,422 22,500 4.75 75.17 2,800.64 16,341.81 1.15 6.68 46 718 4.85 75.74 14,516.80 110,765.73 2.53 19.32 518.34 677.81
10 2,000.00 2,500.00 1,264 23,764 4.22 79.39 3,305.93 19,647.73 1.35 8.04 41 759 4.32 80.06 18,221.73 128,987.46 3.18 22.50 551.18 656.50
11 2,500.00 3,000.00 758 24,522 2.53 81.92 2,358.35 22,006.09 0.96 9.00 10 769 1.05 81.12 5,253.38 134,240.84 0.92 23.42 222.76 610.02
12 3,000.00 4,000.00 1,153 25,675 3.85 85.77 4,534.40 26,540.49 1.85 10.86 35 804 3.69 84.81 23,607.60 157,848.44 4.12 27.54 520.63 594.75
13 4,000.00 5,000.00 632 26,307 2.11 87.88 3,189.70 29,730.19 1.30 12.16 15 819 1.58 86.39 1,390.36 159,238.80 0.24 27.78 43.59 535.61
14 5,000.00 7,500.00 1,027 27,334 3.43 91.31 7,103.09 36,833.28 2.91 15.07 23 842 2.43 88.82 6,184.14 165,422.94 1.08 28.86 87.06 449.11
15 7,500.00 10,000.00 473 27,807 1.58 92.89 4,610.96 41,444.24 1.89 16.95 9 851 0.95 89.77 14,366.97 179,789.91 2.51 31.36 311.58 433.81
16 10,000.00 20,000.00 943 28,750 3.15 96.04 14,874.59 56,318.83 6.08 23.04 19 870 2.00 91.77 59,765.98 239,555.89 10.43 41.79 401.80 425.36
17 20,000.00 50,000.00 690 29,440 2.31 98.35 23,447.81 79,766.63 9.59 32.63 24 894 2.53 94.30 104,858.68 344,414.57 18.29 60.08 447.20 431.78
18 50,000.00 100,000.00 237 29,677 0.79 99.14 18,429.85 98,196.49 7.54 40.17 9 903 0.95 95.25 523.55 344,938.13 0.09 60.18 2.84 351.27
19 100,000.00 500,000.00 210 29,887 0.70 99.84 51,399.15 149,595.63 21.02 61.19 33 936 3.48 98.73 136,901.31 481,839.44 23.88 84.06 266.35 322.09
20 500,000.00 UP 47 29,934 0.16 100.00 74,992.31 224,587.94 30.67 91.87 3 939 0.32 99.05 157.50 481,996.94 0.03 84.09 0.21 214.61
19,885.97 244,473.91 8.13 100.00 9 948 0.95 100.00 91,223.01 573,219.95 15.91 100.00 458.73 234.47
*) Multilocation = resiko multi lokasi yang karena kurang lengkapnya data yang kami terima, resiko tersebut tidak dapat kami identifikasi sebagai any one risk
PT. Asuransi MAIPARK Indonesia
RISK & LOSS PROFILE
CLAIM FREQUENCY LOSS RATIO
BAND f F
∑(d)
rp
GROSS PREMIUM (In Million Rp.) NUMBER OF RISKS
f PERCENTAGE RP
∑(p)
rp
SUM INSURED (BAND)
(In Million Rp.)
PERCENTAGE
01/01/2009
* ) Multilocation
FROM TO
PERCENTAGEPERCENTAGE PERCENTAGE F
∑(l)
RP
∑(h)
INCURRED CLAIM (In Million Rp.)
31/12/2009
01/03/2011

S t a t i s t i k A s u r a n s i G e m p a B u m i I n d o n e s i a 2 0 0 9 46 | P a g e
UNDERWRITING YEAR : 2009 DATA POSITION FROM
OCCUPATION : Industrial
ZONE : All TO
PROCESSING DATE
Table 6.1.3.1
BAND
(d)/∑(d)
CUM.
∑(f)
BAND
(i)/∑(i)
CUM.
∑(j)
BAND
(m)/∑(m)
CUM.
∑(n)
BAND
(q)/∑(q)
CUM.
∑(r)
BAND
(p)/(h)
CUM.
(q)/(i)
(a) (b) (c) (d) ( e) ( f) ( g) (h) ( i) ( j) ( k) (l) (m) ( n) ( o) (p) ( q) ( r) ( s) (t ) (u)
1 0.00 50.00 156 156 2.55 2.55 8.02 8.02 0.00 0.00 0 0 0.00 0.00 0.00 0.00 0.00 0.00 0.00 0.00
2 50.00 100.00 118 274 1.93 4.49 10.42 18.45 0.00 0.00 0 0 0.00 0.00 0.00 0.00 0.00 0.00 0.00 0.00
3 100.00 200.00 171 445 2.80 7.29 27.39 45.84 0.00 0.01 0 0 0.00 0.00 0.00 0.00 0.00 0.00 0.00 0.00
4 200.00 300.00 167 612 2.73 10.02 45.98 91.82 0.01 0.01 0 0 0.00 0.00 0.00 0.00 0.00 0.00 0.00 0.00
5 300.00 500.00 333 945 5.45 15.47 143.26 235.08 0.02 0.03 1 1 6.25 6.25 62.30 62.30 0.61 0.61 43.49 26.50
6 500.00 750.00 391 1,336 6.40 21.87 278.07 513.15 0.04 0.07 0 1 0.00 6.25 0.00 62.30 0.00 0.61 0.00 12.14
7 750.00 1,000.00 257 1,593 4.21 26.08 266.13 779.28 0.03 0.10 0 1 0.00 6.25 0.00 62.30 0.00 0.61 0.00 7.99
8 1,000.00 1,500.00 382 1,975 6.25 32.33 525.25 1,304.53 0.07 0.17 0 1 0.00 6.25 0.00 62.30 0.00 0.61 0.00 4.78
9 1,500.00 2,000.00 293 2,268 4.80 37.13 579.43 1,883.96 0.08 0.25 1 2 6.25 12.50 75.90 138.20 0.75 1.36 13.10 7.34
10 2,000.00 2,500.00 266 2,534 4.35 41.49 658.25 2,542.21 0.09 0.33 1 3 6.25 18.75 35.24 173.44 0.35 1.70 5.35 6.82
11 2,500.00 3,000.00 213 2,747 3.49 44.97 659.68 3,201.90 0.09 0.42 1 4 6.25 25.00 138.63 312.07 1.36 3.07 21.01 9.75
12 3,000.00 4,000.00 319 3,066 5.22 50.20 1,216.43 4,418.33 0.16 0.58 1 5 6.25 31.25 358.75 670.83 3.52 6.59 29.49 15.18
13 4,000.00 5,000.00 180 3,246 2.95 53.14 874.55 5,292.88 0.11 0.69 0 5 0.00 31.25 0.00 670.83 0.00 6.59 0.00 12.67
14 5,000.00 7,500.00 419 3,665 6.86 60.00 2,944.86 8,237.74 0.38 1.07 1 6 6.25 37.50 13.78 684.61 0.14 6.73 0.47 8.31
15 7,500.00 10,000.00 246 3,911 4.03 64.03 2,484.92 10,722.66 0.32 1.40 2 8 12.50 50.00 410.33 1,094.94 4.03 10.76 16.51 10.21
16 10,000.00 20,000.00 626 4,537 10.25 74.28 9,914.03 20,636.69 1.29 2.69 4 12 25.00 75.00 1,212.73 2,307.67 11.91 22.67 12.23 11.18
17 20,000.00 50,000.00 627 5,164 10.27 84.54 22,549.61 43,186.30 2.94 5.63 1 13 6.25 81.25 67.08 2,374.75 0.66 23.33 0.30 5.50
18 50,000.00 100,000.00 340 5,504 5.57 90.11 27,431.19 70,617.49 3.57 9.20 0 13 0.00 81.25 0.00 2,374.75 0.00 23.33 0.00 3.36
19 100,000.00 500,000.00 428 5,932 7.01 97.12 107,037.63 177,655.12 13.95 23.15 3 16 18.75 100.00 7,803.86 10,178.61 76.67 100.00 7.29 5.73
20 500,000.00 UP 176 6,108 2.88 100.00 453,553.80 631,208.92 59.10 82.25 0 16 0.00 100.00 0.00 10,178.61 0.00 100.00 0.00 1.61
136,249.63 767,458.54 17.75 100.00 0 16 0.00 100.00 0.00 10,178.61 0.00 100.00 0.00 1.33
*) Multilocation = resiko multi lokasi yang karena kurang lengkapnya data yang kami terima, resiko tersebut tidak dapat kami identifikasi sebagai any one risk
31/12/2009
01/03/2011
01/01/2009
PERCENTAGE RP
∑(p)
frp RP
∑(h)
INCURRED CLAIM (In Million Rp.)
PERCENTAGE PERCENTAGE F
∑(l)
* ) Multilocation
FROM TO
PERCENTAGE
PT. Asuransi MAIPARK Indonesia
RISK & LOSS PROFILE
CLAIM FREQUENCY LOSS RATIO
BAND f F
∑(d)
SUM INSURED (BAND)
(In Million Rp.)
rp
GROSS PREMIUM (In Million Rp.)
PERCENTAGE
NUMBER OF RISKS
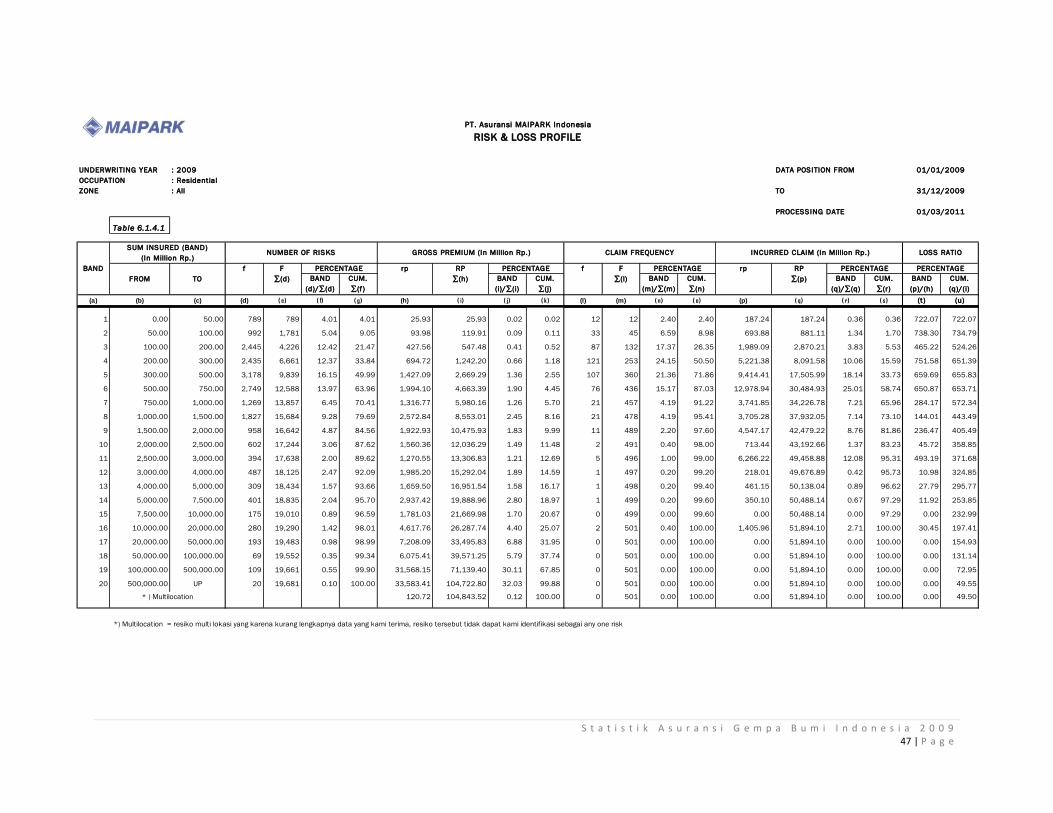
S t a t i s t i k A s u r a n s i G e m p a B u m i I n d o n e s i a 2 0 0 9 47 | P a g e
UNDERWRITING YEAR : 2009 DATA POSITION FROM
OCCUPATION : Residential
ZONE : All TO
PROCESSING DATE
Table 6.1.4.1
BAND
(d)/∑(d)
CUM.
∑(f)
BAND
(i)/∑(i)
CUM.
∑(j)
BAND
(m)/∑(m)
CUM.
∑(n)
BAND
(q)/∑(q)
CUM.
∑(r)
BAND
(p)/(h)
CUM.
(q)/(i)
(a) (b) (c) (d) ( e) ( f) ( g) (h) ( i) ( j) ( k) (l) (m) ( n) ( o) (p) ( q) ( r) ( s) (t ) (u)
1 0.00 50.00 789 789 4.01 4.01 25.93 25.93 0.02 0.02 12 12 2.40 2.40 187.24 187.24 0.36 0.36 722.07 722.07
2 50.00 100.00 992 1,781 5.04 9.05 93.98 119.91 0.09 0.11 33 45 6.59 8.98 693.88 881.11 1.34 1.70 738.30 734.79
3 100.00 200.00 2,445 4,226 12.42 21.47 427.56 547.48 0.41 0.52 87 132 17.37 26.35 1,989.09 2,870.21 3.83 5.53 465.22 524.26
4 200.00 300.00 2,435 6,661 12.37 33.84 694.72 1,242.20 0.66 1.18 121 253 24.15 50.50 5,221.38 8,091.58 10.06 15.59 751.58 651.39
5 300.00 500.00 3,178 9,839 16.15 49.99 1,427.09 2,669.29 1.36 2.55 107 360 21.36 71.86 9,414.41 17,505.99 18.14 33.73 659.69 655.83
6 500.00 750.00 2,749 12,588 13.97 63.96 1,994.10 4,663.39 1.90 4.45 76 436 15.17 87.03 12,978.94 30,484.93 25.01 58.74 650.87 653.71
7 750.00 1,000.00 1,269 13,857 6.45 70.41 1,316.77 5,980.16 1.26 5.70 21 457 4.19 91.22 3,741.85 34,226.78 7.21 65.96 284.17 572.34
8 1,000.00 1,500.00 1,827 15,684 9.28 79.69 2,572.84 8,553.01 2.45 8.16 21 478 4.19 95.41 3,705.28 37,932.05 7.14 73.10 144.01 443.49
9 1,500.00 2,000.00 958 16,642 4.87 84.56 1,922.93 10,475.93 1.83 9.99 11 489 2.20 97.60 4,547.17 42,479.22 8.76 81.86 236.47 405.49
10 2,000.00 2,500.00 602 17,244 3.06 87.62 1,560.36 12,036.29 1.49 11.48 2 491 0.40 98.00 713.44 43,192.66 1.37 83.23 45.72 358.85
11 2,500.00 3,000.00 394 17,638 2.00 89.62 1,270.55 13,306.83 1.21 12.69 5 496 1.00 99.00 6,266.22 49,458.88 12.08 95.31 493.19 371.68
12 3,000.00 4,000.00 487 18,125 2.47 92.09 1,985.20 15,292.04 1.89 14.59 1 497 0.20 99.20 218.01 49,676.89 0.42 95.73 10.98 324.85
13 4,000.00 5,000.00 309 18,434 1.57 93.66 1,659.50 16,951.54 1.58 16.17 1 498 0.20 99.40 461.15 50,138.04 0.89 96.62 27.79 295.77
14 5,000.00 7,500.00 401 18,835 2.04 95.70 2,937.42 19,888.96 2.80 18.97 1 499 0.20 99.60 350.10 50,488.14 0.67 97.29 11.92 253.85
15 7,500.00 10,000.00 175 19,010 0.89 96.59 1,781.03 21,669.98 1.70 20.67 0 499 0.00 99.60 0.00 50,488.14 0.00 97.29 0.00 232.99
16 10,000.00 20,000.00 280 19,290 1.42 98.01 4,617.76 26,287.74 4.40 25.07 2 501 0.40 100.00 1,405.96 51,894.10 2.71 100.00 30.45 197.41
17 20,000.00 50,000.00 193 19,483 0.98 98.99 7,208.09 33,495.83 6.88 31.95 0 501 0.00 100.00 0.00 51,894.10 0.00 100.00 0.00 154.93
18 50,000.00 100,000.00 69 19,552 0.35 99.34 6,075.41 39,571.25 5.79 37.74 0 501 0.00 100.00 0.00 51,894.10 0.00 100.00 0.00 131.14
19 100,000.00 500,000.00 109 19,661 0.55 99.90 31,568.15 71,139.40 30.11 67.85 0 501 0.00 100.00 0.00 51,894.10 0.00 100.00 0.00 72.95
20 500,000.00 UP 20 19,681 0.10 100.00 33,583.41 104,722.80 32.03 99.88 0 501 0.00 100.00 0.00 51,894.10 0.00 100.00 0.00 49.55
120.72 104,843.52 0.12 100.00 0 501 0.00 100.00 0.00 51,894.10 0.00 100.00 0.00 49.50
*) Multilocation = resiko multi lokasi yang karena kurang lengkapnya data yang kami terima, resiko tersebut tidak dapat kami identifikasi sebagai any one risk
01/01/2009
* ) Multilocation
FROM TO
PERCENTAGEPERCENTAGE PERCENTAGE F
∑(l)
RP
∑(h)
INCURRED CLAIM (In Million Rp.)
31/12/2009
01/03/2011
PT. Asuransi MAIPARK Indonesia
RISK & LOSS PROFILE
CLAIM FREQUENCY LOSS RATIO
BAND f F
∑(d)
rp
GROSS PREMIUM (In Million Rp.) NUMBER OF RISKS
f PERCENTAGE RP
∑(p)
rp
SUM INSURED (BAND)
(In Million Rp.)
PERCENTAGE
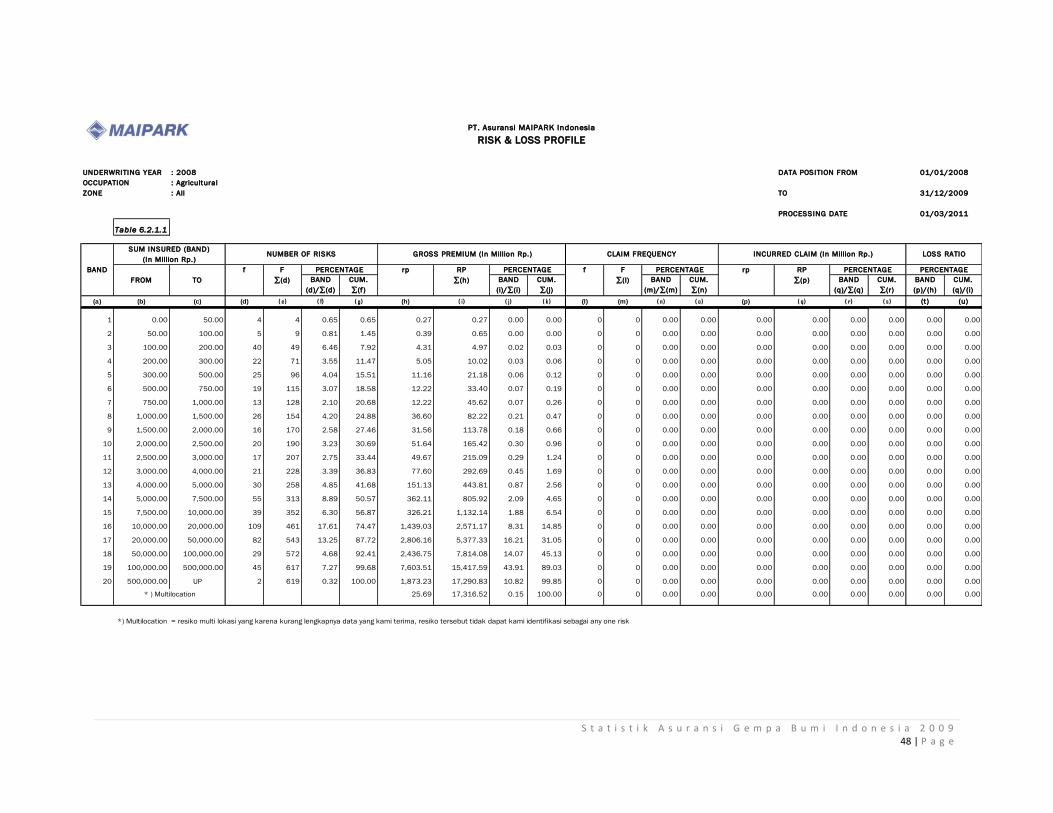
S t a t i s t i k A s u r a n s i G e m p a B u m i I n d o n e s i a 2 0 0 9 48 | P a g e
UNDERWRITING YEAR : 2008 DATA POSITION FROM
OCCUPATION : Agricultural
ZONE : All TO
PROCESSING DATE
Table 6.2.1.1
BAND
(d)/∑(d)
CUM.
∑(f)
BAND
(i)/∑(i)
CUM.
∑(j)
BAND
(m)/∑(m)
CUM.
∑(n)
BAND
(q)/∑(q)
CUM.
∑(r)
BAND
(p)/(h)
CUM.
(q)/(i)
(a) (b) (c) (d) ( e) ( f) ( g) (h) ( i) ( j) ( k) (l) (m) ( n) ( o) (p) ( q) ( r) ( s) (t ) (u)
1 0.00 50.00 4 4 0.65 0.65 0.27 0.27 0.00 0.00 0 0 0.00 0.00 0.00 0.00 0.00 0.00 0.00 0.00
2 50.00 100.00 5 9 0.81 1.45 0.39 0.65 0.00 0.00 0 0 0.00 0.00 0.00 0.00 0.00 0.00 0.00 0.00
3 100.00 200.00 40 49 6.46 7.92 4.31 4.97 0.02 0.03 0 0 0.00 0.00 0.00 0.00 0.00 0.00 0.00 0.00
4 200.00 300.00 22 71 3.55 11.47 5.05 10.02 0.03 0.06 0 0 0.00 0.00 0.00 0.00 0.00 0.00 0.00 0.00
5 300.00 500.00 25 96 4.04 15.51 11.16 21.18 0.06 0.12 0 0 0.00 0.00 0.00 0.00 0.00 0.00 0.00 0.00
6 500.00 750.00 19 115 3.07 18.58 12.22 33.40 0.07 0.19 0 0 0.00 0.00 0.00 0.00 0.00 0.00 0.00 0.00
7 750.00 1,000.00 13 128 2.10 20.68 12.22 45.62 0.07 0.26 0 0 0.00 0.00 0.00 0.00 0.00 0.00 0.00 0.00
8 1,000.00 1,500.00 26 154 4.20 24.88 36.60 82.22 0.21 0.47 0 0 0.00 0.00 0.00 0.00 0.00 0.00 0.00 0.00
9 1,500.00 2,000.00 16 170 2.58 27.46 31.56 113.78 0.18 0.66 0 0 0.00 0.00 0.00 0.00 0.00 0.00 0.00 0.00
10 2,000.00 2,500.00 20 190 3.23 30.69 51.64 165.42 0.30 0.96 0 0 0.00 0.00 0.00 0.00 0.00 0.00 0.00 0.00
11 2,500.00 3,000.00 17 207 2.75 33.44 49.67 215.09 0.29 1.24 0 0 0.00 0.00 0.00 0.00 0.00 0.00 0.00 0.00
12 3,000.00 4,000.00 21 228 3.39 36.83 77.60 292.69 0.45 1.69 0 0 0.00 0.00 0.00 0.00 0.00 0.00 0.00 0.00
13 4,000.00 5,000.00 30 258 4.85 41.68 151.13 443.81 0.87 2.56 0 0 0.00 0.00 0.00 0.00 0.00 0.00 0.00 0.00
14 5,000.00 7,500.00 55 313 8.89 50.57 362.11 805.92 2.09 4.65 0 0 0.00 0.00 0.00 0.00 0.00 0.00 0.00 0.00
15 7,500.00 10,000.00 39 352 6.30 56.87 326.21 1,132.14 1.88 6.54 0 0 0.00 0.00 0.00 0.00 0.00 0.00 0.00 0.00
16 10,000.00 20,000.00 109 461 17.61 74.47 1,439.03 2,571.17 8.31 14.85 0 0 0.00 0.00 0.00 0.00 0.00 0.00 0.00 0.00
17 20,000.00 50,000.00 82 543 13.25 87.72 2,806.16 5,377.33 16.21 31.05 0 0 0.00 0.00 0.00 0.00 0.00 0.00 0.00 0.00
18 50,000.00 100,000.00 29 572 4.68 92.41 2,436.75 7,814.08 14.07 45.13 0 0 0.00 0.00 0.00 0.00 0.00 0.00 0.00 0.00
19 100,000.00 500,000.00 45 617 7.27 99.68 7,603.51 15,417.59 43.91 89.03 0 0 0.00 0.00 0.00 0.00 0.00 0.00 0.00 0.00
20 500,000.00 UP 2 619 0.32 100.00 1,873.23 17,290.83 10.82 99.85 0 0 0.00 0.00 0.00 0.00 0.00 0.00 0.00 0.00
25.69 17,316.52 0.15 100.00 0 0 0.00 0.00 0.00 0.00 0.00 0.00 0.00 0.00
*) Multilocation = resiko multi lokasi yang karena kurang lengkapnya data yang kami terima, resiko tersebut tidak dapat kami identifikasi sebagai any one risk
INCURRED CLAIM (In Million Rp.)
31/12/2009
01/03/2011
01/01/2008
* ) Multilocation
FROM TO
PERCENTAGEPERCENTAGE PERCENTAGE F
∑(l)
RP
∑(h)
PT. Asuransi MAIPARK Indonesia
RISK & LOSS PROFILE
CLAIM FREQUENCY LOSS RATIO
f F
∑(d)
rp
GROSS PREMIUM (In Million Rp.)
PERCENTAGE
NUMBER OF RISKS
BAND
SUM INSURED (BAND)
(In Million Rp.)
f PERCENTAGE RP
∑(p)
rp

S t a t i s t i k A s u r a n s i G e m p a B u m i I n d o n e s i a 2 0 0 9 49 | P a g e
UNDERWRITING YEAR : 2008 DATA POSITION FROM
OCCUPATION : Commercial
ZONE : All TO
PROCESSING DATE
Table 2.2.2.1
BAND
(d)/∑(d)
CUM.
∑(f)
BAND
(i)/∑(i)
CUM.
∑(j)
BAND
(m)/∑(m)
CUM.
∑(n)
BAND
(q)/∑(q)
CUM.
∑(r)
BAND
(p)/(h)
CUM.
(q)/(i)
(a) (b) (c) (d) ( e) ( f) ( g) (h) ( i) ( j) ( k) (l) (m) ( n) ( o) (p) ( q) ( r) ( s) (t ) (u)
1 0.00 50.00 8,347 8,347 14.65 14.65 195.14 195.14 0.04 0.04 3 3 0.71 0.71 43.01 43.01 0.02 0.02 22.04 22.04
2 50.00 100.00 4,936 13,283 8.66 23.31 308.10 503.25 0.07 0.11 8 11 1.90 2.61 200.96 243.97 0.07 0.09 65.23 48.48
3 100.00 200.00 6,138 19,421 10.77 34.08 858.72 1,361.97 0.19 0.31 28 39 6.64 9.24 786.55 1,030.52 0.28 0.36 91.60 75.66
4 200.00 300.00 3,861 23,282 6.78 40.86 1,037.85 2,399.82 0.23 0.54 41 80 9.72 18.96 2,623.22 3,653.74 0.92 1.28 252.76 152.25
5 300.00 500.00 5,088 28,370 8.93 49.79 2,370.03 4,769.85 0.54 1.08 47 127 11.14 30.09 6,183.43 9,837.17 2.17 3.46 260.90 206.24
6 500.00 750.00 7,960 36,330 13.97 63.76 6,055.04 10,824.89 1.37 2.45 49 176 11.61 41.71 10,463.25 20,300.42 3.68 7.14 172.80 187.53
7 750.00 1,000.00 3,813 40,143 6.69 70.45 3,958.27 14,783.16 0.90 3.35 22 198 5.21 46.92 6,978.15 27,278.57 2.45 9.59 176.29 184.52
8 1,000.00 1,500.00 4,014 44,157 7.04 77.50 5,878.61 20,661.77 1.33 4.68 34 232 8.06 54.98 6,450.80 33,729.37 2.27 11.86 109.73 163.25
9 1,500.00 2,000.00 2,162 46,319 3.79 81.29 4,373.48 25,035.25 0.99 5.67 29 261 6.87 61.85 12,491.42 46,220.79 4.39 16.25 285.62 184.62
10 2,000.00 2,500.00 1,698 48,017 2.98 84.27 4,455.43 29,490.68 1.01 6.67 19 280 4.50 66.35 13,232.56 59,453.35 4.65 20.90 297.00 201.60
11 2,500.00 3,000.00 1,037 49,054 1.82 86.09 3,341.72 32,832.41 0.76 7.43 11 291 2.61 68.96 13,017.41 72,470.76 4.58 25.47 389.54 220.73
12 3,000.00 4,000.00 1,468 50,522 2.58 88.67 5,904.66 38,737.07 1.34 8.77 13 304 3.08 72.04 12,542.47 85,013.23 4.41 29.88 212.42 219.46
13 4,000.00 5,000.00 925 51,447 1.62 90.29 4,922.04 43,659.11 1.11 9.88 17 321 4.03 76.07 2,739.97 87,753.20 0.96 30.84 55.67 201.00
14 5,000.00 7,500.00 1,491 52,938 2.62 92.91 10,683.17 54,342.27 2.42 12.30 16 337 3.79 79.86 4,507.48 92,260.68 1.58 32.43 42.19 169.78
15 7,500.00 10,000.00 710 53,648 1.25 94.15 7,148.52 61,490.79 1.62 13.92 13 350 3.08 82.94 14,256.30 106,516.98 5.01 37.44 199.43 173.22
16 10,000.00 20,000.00 1,365 55,013 2.40 96.55 22,047.34 83,538.14 4.99 18.91 18 368 4.27 87.20 45,095.52 151,612.50 15.85 53.29 204.54 181.49
17 20,000.00 50,000.00 1,055 56,068 1.85 98.40 38,226.12 121,764.26 8.65 27.56 12 380 2.84 90.05 7,082.48 158,694.98 2.49 55.78 18.53 130.33
18 50,000.00 100,000.00 438 56,506 0.77 99.17 37,564.56 159,328.82 8.50 36.06 13 393 3.08 93.13 88,975.76 247,670.75 31.27 87.05 236.86 155.45
19 100,000.00 500,000.00 403 56,909 0.71 99.88 107,175.01 266,503.83 24.26 60.32 20 413 4.74 97.87 8,274.58 255,945.33 2.91 89.96 7.72 96.04
20 500,000.00 UP 71 56,980 0.12 100.00 102,166.24 368,670.07 23.12 83.44 7 420 1.66 99.53 2,699.93 258,645.26 0.95 90.91 2.64 70.16
73,168.20 441,838.27 16.56 100.00 2 422 0.47 100.00 25,863.72 284,508.98 9.09 100.00 35.35 64.39
*) Multilocation = resiko multi lokasi yang karena kurang lengkapnya data yang kami terima, resiko tersebut tidak dapat kami identifikasi sebagai any one risk
31/12/2009
01/03/2011
01/01/2008
* ) Multilocation
INCURRED CLAIM (In Million Rp.)
FROM TO
PERCENTAGEPERCENTAGE PERCENTAGE F
∑(l)
RP
∑(h)
PT. Asuransi MAIPARK Indonesia
RISK & LOSS PROFILE
CLAIM FREQUENCY LOSS RATIO
BAND f F
∑(d)
SUM INSURED (BAND)
(In Million Rp.)
rp
GROSS PREMIUM (In Million Rp.)
PERCENTAGE
NUMBER OF RISKS
f PERCENTAGE RP
∑(p)
rp

S t a t i s t i k A s u r a n s i G e m p a B u m i I n d o n e s i a 2 0 0 9 50 | P a g e
UNDERWRITING YEAR : 2008 DATA POSITION FROM
OCCUPATION : Industrial
ZONE : All TO
PROCESSING DATE
Table 6.2.3.1
BAND
(d)/∑(d)
CUM.
∑(f)
BAND
(i)/∑(i)
CUM.
∑(j)
BAND
(m)/∑(m)
CUM.
∑(n)
BAND
(q)/∑(q)
CUM.
∑(r)
BAND
(p)/(h)
CUM.
(q)/(i)
(a) (b) (c) (d) ( e) ( f) ( g) (h) ( i) ( j) ( k) (l) (m) ( n) ( o) (p) ( q) ( r) ( s) (t ) (u)
1 0.00 50.00 326 326 3.50 3.50 881.23 881.23 0.08 0.08 0 0 0.00 0.00 0.00 0.00 0.00 0.00 0.00 0.00
2 50.00 100.00 405 731 4.35 7.85 28.12 909.35 0.00 0.08 3 3 23.08 23.08 386.67 386.67 0.88 0.88 1,374.91 42.52
3 100.00 200.00 341 1,072 3.66 11.51 53.92 963.27 0.00 0.08 0 3 0.00 23.08 0.00 386.67 0.00 0.88 0.00 40.14
4 200.00 300.00 279 1,351 3.00 14.51 89.88 1,053.16 0.01 0.09 0 3 0.00 23.08 0.00 386.67 0.00 0.88 0.00 36.72
5 300.00 500.00 377 1,728 4.05 18.55 185.63 1,238.78 0.02 0.11 0 3 0.00 23.08 0.00 386.67 0.00 0.88 0.00 31.21
6 500.00 750.00 460 2,188 4.94 23.49 353.29 1,592.08 0.03 0.14 2 5 15.38 38.46 377.78 764.44 0.86 1.75 106.93 48.02
7 750.00 1,000.00 273 2,461 2.93 26.42 301.87 1,893.94 0.03 0.17 1 6 7.69 46.15 188.89 953.33 0.43 2.18 62.57 50.34
8 1,000.00 1,500.00 507 2,968 5.44 31.87 733.88 2,627.82 0.06 0.23 0 6 0.00 46.15 0.00 953.33 0.00 2.18 0.00 36.28
9 1,500.00 2,000.00 431 3,399 4.63 36.49 908.83 3,536.65 0.08 0.31 0 6 0.00 46.15 0.00 953.33 0.00 2.18 0.00 26.96
10 2,000.00 2,500.00 335 3,734 3.60 40.09 901.88 4,438.53 0.08 0.39 0 6 0.00 46.15 0.00 953.33 0.00 2.18 0.00 21.48
11 2,500.00 3,000.00 273 4,007 2.93 43.02 923.26 5,361.79 0.08 0.47 1 7 7.69 53.85 79.89 1,033.23 0.18 2.36 8.65 19.27
12 3,000.00 4,000.00 396 4,403 4.25 47.27 1,663.58 7,025.37 0.15 0.61 0 7 0.00 53.85 0.00 1,033.23 0.00 2.36 0.00 14.71
13 4,000.00 5,000.00 320 4,723 3.44 50.71 1,743.57 8,768.94 0.15 0.77 0 7 0.00 53.85 0.00 1,033.23 0.00 2.36 0.00 11.78
14 5,000.00 7,500.00 664 5,387 7.13 57.84 4,996.44 13,765.38 0.44 1.20 2 9 15.38 69.23 5.66 1,038.89 0.01 2.37 0.11 7.55
15 7,500.00 10,000.00 398 5,785 4.27 62.11 4,230.11 17,995.48 0.37 1.57 0 9 0.00 69.23 0.00 1,038.89 0.00 2.37 0.00 5.77
16 10,000.00 20,000.00 921 6,706 9.89 72.00 15,897.47 33,892.96 1.39 2.96 0 9 0.00 69.23 0.00 1,038.89 0.00 2.37 0.00 3.07
17 20,000.00 50,000.00 1,026 7,732 11.02 83.01 40,381.93 74,274.88 3.52 6.48 2 11 15.38 84.62 427.57 1,466.46 0.98 3.35 1.06 1.97
18 50,000.00 100,000.00 616 8,348 6.61 89.63 54,607.26 128,882.14 4.77 11.25 1 12 7.69 92.31 2,328.28 3,794.74 5.32 8.66 4.26 2.94
19 100,000.00 500,000.00 713 9,061 7.66 97.28 187,412.49 316,294.63 16.36 27.61 0 12 0.00 92.31 0.00 3,794.74 0.00 8.66 0.00 1.20
20 500,000.00 UP 253 9,314 2.72 100.00 651,619.48 967,914.11 56.88 84.49 1 13 7.69 100.00 40,000.00 43,794.74 91.34 100.00 6.14 4.52
177,717.14 1,145,631.25 15.51 100.00 0 13 0.00 100.00 0.00 43,794.74 0.00 100.00 0.00 3.82
*) Multilocation = resiko multi lokasi yang karena kurang lengkapnya data yang kami terima, resiko tersebut tidak dapat kami identifikasi sebagai any one risk
INCURRED CLAIM (In Million Rp.)
31/12/2009
01/03/2011
01/01/2008
* ) Multilocation
FROM TO
PERCENTAGEPERCENTAGE PERCENTAGE F
∑(l)
RP
∑(h)
PT. Asuransi MAIPARK Indonesia
RISK & LOSS PROFILE
CLAIM FREQUENCY LOSS RATIO
f F
∑(d)
rp
GROSS PREMIUM (In Million Rp.)
PERCENTAGE
NUMBER OF RISKS
BAND
SUM INSURED (BAND)
(In Million Rp.)
f PERCENTAGE RP
∑(p)
rp
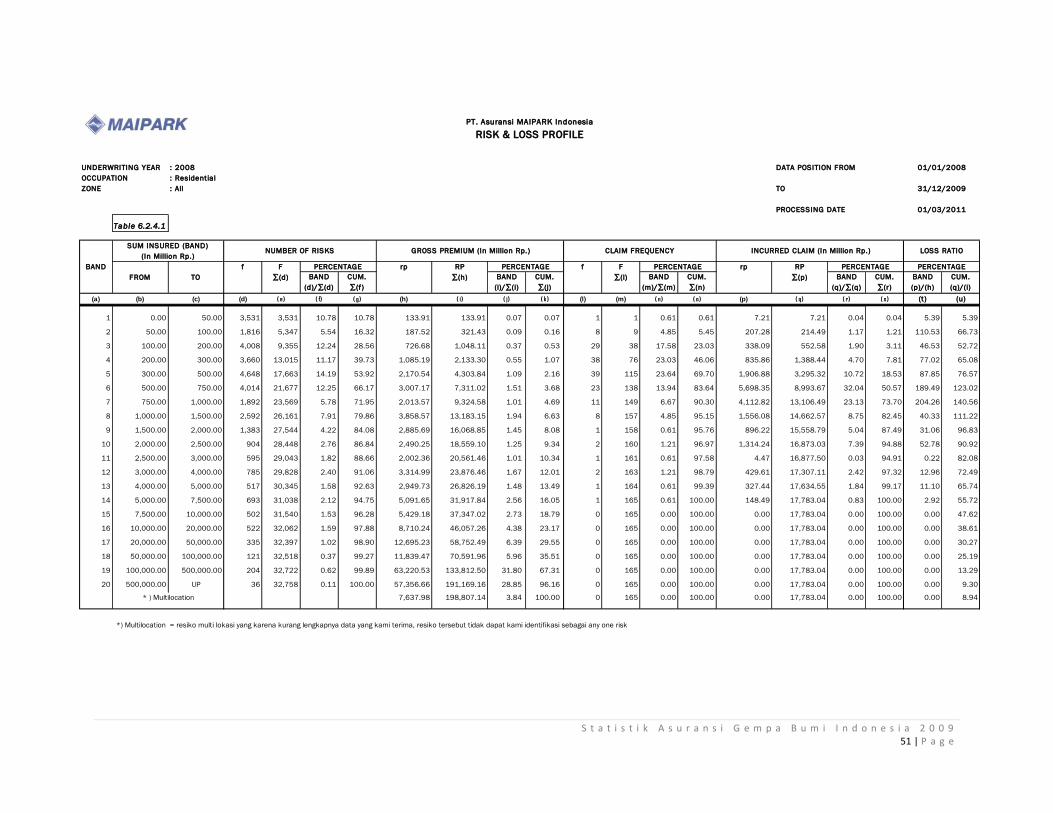
S t a t i s t i k A s u r a n s i G e m p a B u m i I n d o n e s i a 2 0 0 9 51 | P a g e
UNDERWRITING YEAR : 2008 DATA POSITION FROM
OCCUPATION : Residential
ZONE : All TO
PROCESSING DATE
Table 6.2.4.1
BAND
(d)/∑(d)
CUM.
∑(f)
BAND
(i)/∑(i)
CUM.
∑(j)
BAND
(m)/∑(m)
CUM.
∑(n)
BAND
(q)/∑(q)
CUM.
∑(r)
BAND
(p)/(h)
CUM.
(q)/(i)
(a) (b) (c) (d) ( e) ( f) ( g) (h) ( i) ( j) ( k) (l) (m) ( n) ( o) (p) ( q) ( r) ( s) (t ) (u)
1 0.00 50.00 3,531 3,531 10.78 10.78 133.91 133.91 0.07 0.07 1 1 0.61 0.61 7.21 7.21 0.04 0.04 5.39 5.39
2 50.00 100.00 1,816 5,347 5.54 16.32 187.52 321.43 0.09 0.16 8 9 4.85 5.45 207.28 214.49 1.17 1.21 110.53 66.73
3 100.00 200.00 4,008 9,355 12.24 28.56 726.68 1,048.11 0.37 0.53 29 38 17.58 23.03 338.09 552.58 1.90 3.11 46.53 52.72
4 200.00 300.00 3,660 13,015 11.17 39.73 1,085.19 2,133.30 0.55 1.07 38 76 23.03 46.06 835.86 1,388.44 4.70 7.81 77.02 65.08
5 300.00 500.00 4,648 17,663 14.19 53.92 2,170.54 4,303.84 1.09 2.16 39 115 23.64 69.70 1,906.88 3,295.32 10.72 18.53 87.85 76.57
6 500.00 750.00 4,014 21,677 12.25 66.17 3,007.17 7,311.02 1.51 3.68 23 138 13.94 83.64 5,698.35 8,993.67 32.04 50.57 189.49 123.02
7 750.00 1,000.00 1,892 23,569 5.78 71.95 2,013.57 9,324.58 1.01 4.69 11 149 6.67 90.30 4,112.82 13,106.49 23.13 73.70 204.26 140.56
8 1,000.00 1,500.00 2,592 26,161 7.91 79.86 3,858.57 13,183.15 1.94 6.63 8 157 4.85 95.15 1,556.08 14,662.57 8.75 82.45 40.33 111.22
9 1,500.00 2,000.00 1,383 27,544 4.22 84.08 2,885.69 16,068.85 1.45 8.08 1 158 0.61 95.76 896.22 15,558.79 5.04 87.49 31.06 96.83
10 2,000.00 2,500.00 904 28,448 2.76 86.84 2,490.25 18,559.10 1.25 9.34 2 160 1.21 96.97 1,314.24 16,873.03 7.39 94.88 52.78 90.92
11 2,500.00 3,000.00 595 29,043 1.82 88.66 2,002.36 20,561.46 1.01 10.34 1 161 0.61 97.58 4.47 16,877.50 0.03 94.91 0.22 82.08
12 3,000.00 4,000.00 785 29,828 2.40 91.06 3,314.99 23,876.46 1.67 12.01 2 163 1.21 98.79 429.61 17,307.11 2.42 97.32 12.96 72.49
13 4,000.00 5,000.00 517 30,345 1.58 92.63 2,949.73 26,826.19 1.48 13.49 1 164 0.61 99.39 327.44 17,634.55 1.84 99.17 11.10 65.74
14 5,000.00 7,500.00 693 31,038 2.12 94.75 5,091.65 31,917.84 2.56 16.05 1 165 0.61 100.00 148.49 17,783.04 0.83 100.00 2.92 55.72
15 7,500.00 10,000.00 502 31,540 1.53 96.28 5,429.18 37,347.02 2.73 18.79 0 165 0.00 100.00 0.00 17,783.04 0.00 100.00 0.00 47.62
16 10,000.00 20,000.00 522 32,062 1.59 97.88 8,710.24 46,057.26 4.38 23.17 0 165 0.00 100.00 0.00 17,783.04 0.00 100.00 0.00 38.61
17 20,000.00 50,000.00 335 32,397 1.02 98.90 12,695.23 58,752.49 6.39 29.55 0 165 0.00 100.00 0.00 17,783.04 0.00 100.00 0.00 30.27
18 50,000.00 100,000.00 121 32,518 0.37 99.27 11,839.47 70,591.96 5.96 35.51 0 165 0.00 100.00 0.00 17,783.04 0.00 100.00 0.00 25.19
19 100,000.00 500,000.00 204 32,722 0.62 99.89 63,220.53 133,812.50 31.80 67.31 0 165 0.00 100.00 0.00 17,783.04 0.00 100.00 0.00 13.29
20 500,000.00 UP 36 32,758 0.11 100.00 57,356.66 191,169.16 28.85 96.16 0 165 0.00 100.00 0.00 17,783.04 0.00 100.00 0.00 9.30
7,637.98 198,807.14 3.84 100.00 0 165 0.00 100.00 0.00 17,783.04 0.00 100.00 0.00 8.94
*) Multilocation = resiko multi lokasi yang karena kurang lengkapnya data yang kami terima, resiko tersebut tidak dapat kami identifikasi sebagai any one risk
PT. Asuransi MAIPARK Indonesia
RISK & LOSS PROFILE
CLAIM FREQUENCY LOSS RATIO
BAND f F
∑(d)
SUM INSURED (BAND)
(In Million Rp.)
rp
GROSS PREMIUM (In Million Rp.)
PERCENTAGE
NUMBER OF RISKS
f PERCENTAGE RP
∑(p)
rp
31/12/2009
01/03/2011
01/01/2008
* ) Multilocation
INCURRED CLAIM (In Million Rp.)
FROM TO
PERCENTAGEPERCENTAGE PERCENTAGE F
∑(l)
RP
∑(h)

S t a t i s t i k A s u r a n s i G e m p a B u m i I n d o n e s i a 2 0 0 9 52 | P a g e
UNDERWRITING YEAR : 2007 DATA POSITION FROM
OCCUPATION : Agricultural
ZONE : All TO
PROCESSING DATE
Table 6.3.1.1
BAND
(d)/∑(d)
CUM.
∑(f)
BAND
(i)/∑(i)
CUM.
∑(j)
BAND
(m)/∑(m)
CUM.
∑(n)
BAND
(q)/∑(q)
CUM.
∑(r)
BAND
(p)/(h)
CUM.
(q)/(i)
(a) (b) (c) (d) ( e) ( f) ( g) (h) ( i) ( j) ( k) (l) (m) ( n) ( o) (p) ( q) ( r) ( s) (t ) (u)
1 0.00 50.00 1 1 0.24 0.24 0.05 0.05 0.00 0.00 0 0 0.00 0.00 0.00 0.00 0.00 0.00 0.00 0.00
2 50.00 100.00 7 8 1.69 1.94 0.50 0.55 0.01 0.01 0 0 0.00 0.00 0.00 0.00 0.00 0.00 0.00 0.00
3 100.00 200.00 14 22 3.39 5.33 0.98 1.53 0.01 0.02 0 0 0.00 0.00 0.00 0.00 0.00 0.00 0.00 0.00
4 200.00 300.00 9 31 2.18 7.51 1.23 2.75 0.01 0.03 0 0 0.00 0.00 0.00 0.00 0.00 0.00 0.00 0.00
5 300.00 500.00 11 42 2.66 10.17 4.55 7.30 0.05 0.07 0 0 0.00 0.00 0.00 0.00 0.00 0.00 0.00 0.00
6 500.00 750.00 17 59 4.12 14.29 11.80 19.10 0.12 0.19 0 0 0.00 0.00 0.00 0.00 0.00 0.00 0.00 0.00
7 750.00 1,000.00 14 73 3.39 17.68 14.39 33.50 0.14 0.34 0 0 0.00 0.00 0.00 0.00 0.00 0.00 0.00 0.00
8 1,000.00 1,500.00 10 83 2.42 20.10 14.19 47.69 0.14 0.48 0 0 0.00 0.00 0.00 0.00 0.00 0.00 0.00 0.00
9 1,500.00 2,000.00 12 95 2.91 23.00 24.66 72.35 0.25 0.73 0 0 0.00 0.00 0.00 0.00 0.00 0.00 0.00 0.00
10 2,000.00 2,500.00 4 99 0.97 23.97 10.00 82.36 0.10 0.83 0 0 0.00 0.00 0.00 0.00 0.00 0.00 0.00 0.00
11 2,500.00 3,000.00 9 108 2.18 26.15 29.97 112.33 0.30 1.13 0 0 0.00 0.00 0.00 0.00 0.00 0.00 0.00 0.00
12 3,000.00 4,000.00 17 125 4.12 30.27 66.03 178.36 0.66 1.79 0 0 0.00 0.00 0.00 0.00 0.00 0.00 0.00 0.00
13 4,000.00 5,000.00 13 138 3.15 33.41 61.94 240.30 0.62 2.41 0 0 0.00 0.00 0.00 0.00 0.00 0.00 0.00 0.00
14 5,000.00 7,500.00 44 182 10.65 44.07 259.82 500.13 2.61 5.02 0 0 0.00 0.00 0.00 0.00 0.00 0.00 0.00 0.00
15 7,500.00 10,000.00 21 203 5.08 49.15 188.17 688.30 1.89 6.91 0 0 0.00 0.00 0.00 0.00 0.00 0.00 0.00 0.00
16 10,000.00 20,000.00 81 284 19.61 68.77 1,148.50 1,836.80 11.53 18.44 2 2 100.00 100.00 228.31 228.31 100.00 100.00 19.88 12.43
17 20,000.00 50,000.00 61 345 14.77 83.54 1,918.14 3,754.94 19.26 37.70 0 2 0.00 100.00 0.00 228.31 0.00 100.00 0.00 6.08
18 50,000.00 100,000.00 43 388 10.41 93.95 2,306.15 6,061.08 23.16 60.86 0 2 0.00 100.00 0.00 228.31 0.00 100.00 0.00 3.77
19 100,000.00 500,000.00 25 413 6.05 100.00 3,898.41 9,959.50 39.14 100.00 0 2 0.00 100.00 0.00 228.31 0.00 100.00 0.00 2.29
20 500,000.00 UP 0 413 0.00 100.00 0.00 9,959.50 0.00 100.00 0 2 0.00 100.00 0.00 228.31 0.00 100.00 0.00 2.29
0.00 9,959.50 0.00 100.00 0 2 0.00 100.00 0.00 228.31 0.00 100.00 0.00 2.29
*) Multilocation = resiko multi lokasi yang karena kurang lengkapnya data yang kami terima, resiko tersebut tidak dapat kami identifikasi sebagai any one risk
rp
GROSS PREMIUM (In Million Rp.) NUMBER OF RISKS
01/01/2007
* ) Multilocation
FROM TO
PERCENTAGEPERCENTAGE PERCENTAGE F
∑(l)
CLAIM FREQUENCY
PT. Asuransi MAIPARK Indonesia
RISK & LOSS PROFILE
LOSS RATIO
PERCENTAGEf PERCENTAGE RP
∑(p)
rp RP
∑(h)
INCURRED CLAIM (In Million Rp.)
31/12/2009
01/03/2011
BAND f F
∑(d)
SUM INSURED (BAND)
(In Million Rp.)

S t a t i s t i k A s u r a n s i G e m p a B u m i I n d o n e s i a 2 0 0 9 53 | P a g e
UNDERWRITING YEAR : 2007 DATA POSITION FROM
OCCUPATION : Commercial
ZONE : All TO
PROCESSING DATE
Table 6.3.2.1
BAND
(d)/∑(d)
CUM.
∑(f)
BAND
(i)/∑(i)
CUM.
∑(j)
BAND
(m)/∑(m)
CUM.
∑(n)
BAND
(q)/∑(q)
CUM.
∑(r)
BAND
(p)/(h)
CUM.
(q)/(i)
(a) (b) (c) (d) ( e) ( f) ( g) (h) ( i) ( j) ( k) (l) (m) ( n) ( o) (p) ( q) ( r) ( s) (t ) (u)
1 0.00 50.00 3,503 3,503 9.18 9.18 100.06 100.06 0.03 0.03 1 1 0.45 0.45 13.73 13.73 0.02 0.02 13.72 13.72
2 50.00 100.00 1,877 5,380 4.92 14.09 177.59 277.65 0.05 0.07 3 4 1.34 1.79 122.74 136.47 0.15 0.17 69.11 49.15
3 100.00 200.00 3,791 9,171 9.93 24.02 623.49 901.13 0.16 0.24 7 11 3.13 4.91 178.50 314.97 0.22 0.39 28.63 34.95
4 200.00 300.00 2,834 12,005 7.42 31.45 798.87 1,700.00 0.21 0.44 11 22 4.91 9.82 182.74 497.71 0.23 0.62 22.88 29.28
5 300.00 500.00 4,195 16,200 10.99 42.44 1,934.80 3,634.80 0.51 0.95 34 56 15.18 25.00 1,333.62 1,831.34 1.66 2.28 68.93 50.38
6 500.00 750.00 4,291 20,491 11.24 53.68 3,111.51 6,746.31 0.81 1.76 23 79 10.27 35.27 1,385.96 3,217.30 1.73 4.01 44.54 47.69
7 750.00 1,000.00 2,272 22,763 5.95 59.63 2,275.26 9,021.57 0.59 2.36 18 97 8.04 43.30 350.92 3,568.22 0.44 4.45 15.42 39.55
8 1,000.00 1,500.00 3,517 26,280 9.21 68.84 4,908.21 13,929.78 1.28 3.64 32 129 14.29 57.59 1,899.53 5,467.75 2.37 6.82 38.70 39.25
9 1,500.00 2,000.00 1,958 28,238 5.13 73.97 3,851.47 17,781.25 1.01 4.65 11 140 4.91 62.50 1,328.32 6,796.07 1.66 8.47 34.49 38.22
10 2,000.00 2,500.00 1,510 29,748 3.96 77.93 3,857.30 21,638.55 1.01 5.66 8 148 3.57 66.07 649.59 7,445.66 0.81 9.28 16.84 34.41
11 2,500.00 3,000.00 924 30,672 2.42 80.35 2,939.91 24,578.47 0.77 6.43 9 157 4.02 70.09 1,235.26 8,680.92 1.54 10.83 42.02 35.32
12 3,000.00 4,000.00 1,384 32,056 3.63 83.97 5,689.63 30,268.10 1.49 7.91 11 168 4.91 75.00 3,103.33 11,784.25 3.87 14.70 54.54 38.93
13 4,000.00 5,000.00 881 32,937 2.31 86.28 4,553.45 34,821.55 1.19 9.11 7 175 3.13 78.13 739.48 12,523.73 0.92 15.62 16.24 35.97
14 5,000.00 7,500.00 1,417 34,354 3.71 89.99 9,882.51 44,704.06 2.58 11.69 12 187 5.36 83.48 1,737.97 14,261.70 2.17 17.78 17.59 31.90
15 7,500.00 10,000.00 772 35,126 2.02 92.01 7,680.28 52,384.34 2.01 13.70 1 188 0.45 83.93 37.93 14,299.63 0.05 17.83 0.49 27.30
16 10,000.00 20,000.00 1,208 36,334 3.16 95.18 19,467.35 71,851.69 5.09 18.79 6 194 2.68 86.61 2,038.71 16,338.34 2.54 20.37 10.47 22.74
17 20,000.00 50,000.00 1,020 37,354 2.67 97.85 36,696.24 108,547.93 9.60 28.38 8 202 3.57 90.18 4,530.50 20,868.84 5.65 26.02 12.35 19.23
18 50,000.00 100,000.00 407 37,761 1.07 98.92 33,601.56 142,149.49 8.79 37.17 6 208 2.68 92.86 4,307.85 25,176.69 5.37 31.40 12.82 17.71
19 100,000.00 500,000.00 358 38,119 0.94 99.85 95,027.37 237,176.87 24.85 62.02 12 220 5.36 98.21 4,795.59 29,972.28 5.98 37.38 5.05 12.64
20 500,000.00 UP 56 38,175 0.15 100.00 69,038.47 306,215.34 18.05 80.07 1 221 0.45 98.66 1.39 29,973.67 0.00 37.38 0.00 9.79
76,208.12 382,423.46 19.93 100.00 3 224 1.34 100.00 50,217.39 80,191.06 62.62 100.00 65.90 20.97
*) Multilocation = resiko multi lokasi yang karena kurang lengkapnya data yang kami terima, resiko tersebut tidak dapat kami identifikasi sebagai any one risk
* ) Multilocation
FROM TO
PERCENTAGEPERCENTAGE PERCENTAGE F
∑(l)
RP
∑(h)
CLAIM FREQUENCY LOSS RATIO
BAND f F
∑(d)
SUM INSURED (BAND)
(In Million Rp.)
rp
GROSS PREMIUM (In Million Rp.)
PERCENTAGE
NUMBER OF RISKS
f PERCENTAGE RP
∑(p)
rp
INCURRED CLAIM (In Million Rp.)
31/12/2009
01/03/2011
01/01/2007
PT. Asuransi MAIPARK Indonesia
RISK & LOSS PROFILE
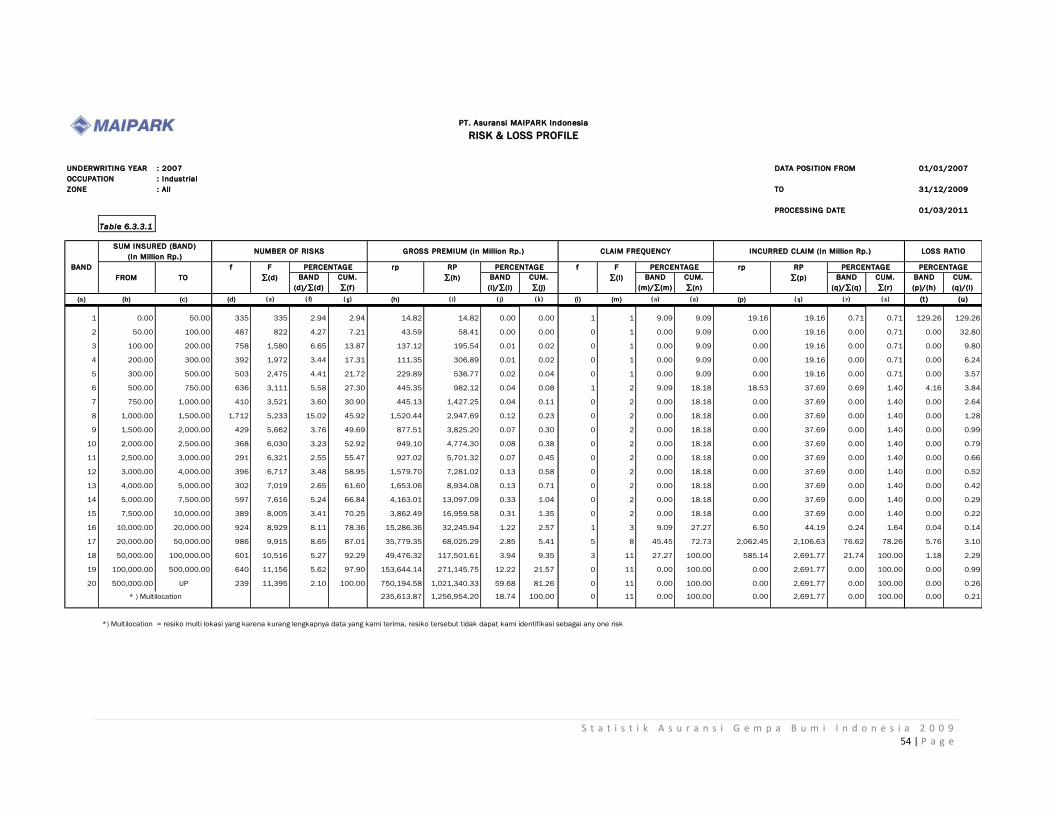
S t a t i s t i k A s u r a n s i G e m p a B u m i I n d o n e s i a 2 0 0 9 54 | P a g e
UNDERWRITING YEAR : 2007 DATA POSITION FROM
OCCUPATION : Industrial
ZONE : All TO
PROCESSING DATE
Table 6.3.3.1
BAND
(d)/∑(d)
CUM.
∑(f)
BAND
(i)/∑(i)
CUM.
∑(j)
BAND
(m)/∑(m)
CUM.
∑(n)
BAND
(q)/∑(q)
CUM.
∑(r)
BAND
(p)/(h)
CUM.
(q)/(i)
(a) (b) (c) (d) ( e) ( f) ( g) (h) ( i) ( j) ( k) (l) (m) ( n) ( o) (p) ( q) ( r) ( s) (t ) (u)
1 0.00 50.00 335 335 2.94 2.94 14.82 14.82 0.00 0.00 1 1 9.09 9.09 19.16 19.16 0.71 0.71 129.26 129.26
2 50.00 100.00 487 822 4.27 7.21 43.59 58.41 0.00 0.00 0 1 0.00 9.09 0.00 19.16 0.00 0.71 0.00 32.80
3 100.00 200.00 758 1,580 6.65 13.87 137.12 195.54 0.01 0.02 0 1 0.00 9.09 0.00 19.16 0.00 0.71 0.00 9.80
4 200.00 300.00 392 1,972 3.44 17.31 111.35 306.89 0.01 0.02 0 1 0.00 9.09 0.00 19.16 0.00 0.71 0.00 6.24
5 300.00 500.00 503 2,475 4.41 21.72 229.89 536.77 0.02 0.04 0 1 0.00 9.09 0.00 19.16 0.00 0.71 0.00 3.57
6 500.00 750.00 636 3,111 5.58 27.30 445.35 982.12 0.04 0.08 1 2 9.09 18.18 18.53 37.69 0.69 1.40 4.16 3.84
7 750.00 1,000.00 410 3,521 3.60 30.90 445.13 1,427.25 0.04 0.11 0 2 0.00 18.18 0.00 37.69 0.00 1.40 0.00 2.64
8 1,000.00 1,500.00 1,712 5,233 15.02 45.92 1,520.44 2,947.69 0.12 0.23 0 2 0.00 18.18 0.00 37.69 0.00 1.40 0.00 1.28
9 1,500.00 2,000.00 429 5,662 3.76 49.69 877.51 3,825.20 0.07 0.30 0 2 0.00 18.18 0.00 37.69 0.00 1.40 0.00 0.99
10 2,000.00 2,500.00 368 6,030 3.23 52.92 949.10 4,774.30 0.08 0.38 0 2 0.00 18.18 0.00 37.69 0.00 1.40 0.00 0.79
11 2,500.00 3,000.00 291 6,321 2.55 55.47 927.02 5,701.32 0.07 0.45 0 2 0.00 18.18 0.00 37.69 0.00 1.40 0.00 0.66
12 3,000.00 4,000.00 396 6,717 3.48 58.95 1,579.70 7,281.02 0.13 0.58 0 2 0.00 18.18 0.00 37.69 0.00 1.40 0.00 0.52
13 4,000.00 5,000.00 302 7,019 2.65 61.60 1,653.06 8,934.08 0.13 0.71 0 2 0.00 18.18 0.00 37.69 0.00 1.40 0.00 0.42
14 5,000.00 7,500.00 597 7,616 5.24 66.84 4,163.01 13,097.09 0.33 1.04 0 2 0.00 18.18 0.00 37.69 0.00 1.40 0.00 0.29
15 7,500.00 10,000.00 389 8,005 3.41 70.25 3,862.49 16,959.58 0.31 1.35 0 2 0.00 18.18 0.00 37.69 0.00 1.40 0.00 0.22
16 10,000.00 20,000.00 924 8,929 8.11 78.36 15,286.36 32,245.94 1.22 2.57 1 3 9.09 27.27 6.50 44.19 0.24 1.64 0.04 0.14
17 20,000.00 50,000.00 986 9,915 8.65 87.01 35,779.35 68,025.29 2.85 5.41 5 8 45.45 72.73 2,062.45 2,106.63 76.62 78.26 5.76 3.10
18 50,000.00 100,000.00 601 10,516 5.27 92.29 49,476.32 117,501.61 3.94 9.35 3 11 27.27 100.00 585.14 2,691.77 21.74 100.00 1.18 2.29
19 100,000.00 500,000.00 640 11,156 5.62 97.90 153,644.14 271,145.75 12.22 21.57 0 11 0.00 100.00 0.00 2,691.77 0.00 100.00 0.00 0.99
20 500,000.00 UP 239 11,395 2.10 100.00 750,194.58 1,021,340.33 59.68 81.26 0 11 0.00 100.00 0.00 2,691.77 0.00 100.00 0.00 0.26
235,613.87 1,256,954.20 18.74 100.00 0 11 0.00 100.00 0.00 2,691.77 0.00 100.00 0.00 0.21
*) Multilocation = resiko multi lokasi yang karena kurang lengkapnya data yang kami terima, resiko tersebut tidak dapat kami identifikasi sebagai any one risk
rp
GROSS PREMIUM (In Million Rp.) NUMBER OF RISKS
01/01/2007
* ) Multilocation
FROM TO
PERCENTAGEPERCENTAGE PERCENTAGE F
∑(l)
CLAIM FREQUENCY
PT. Asuransi MAIPARK Indonesia
RISK & LOSS PROFILE
LOSS RATIO
PERCENTAGEf PERCENTAGE RP
∑(p)
rp RP
∑(h)
INCURRED CLAIM (In Million Rp.)
31/12/2009
01/03/2011
BAND f F
∑(d)
SUM INSURED (BAND)
(In Million Rp.)
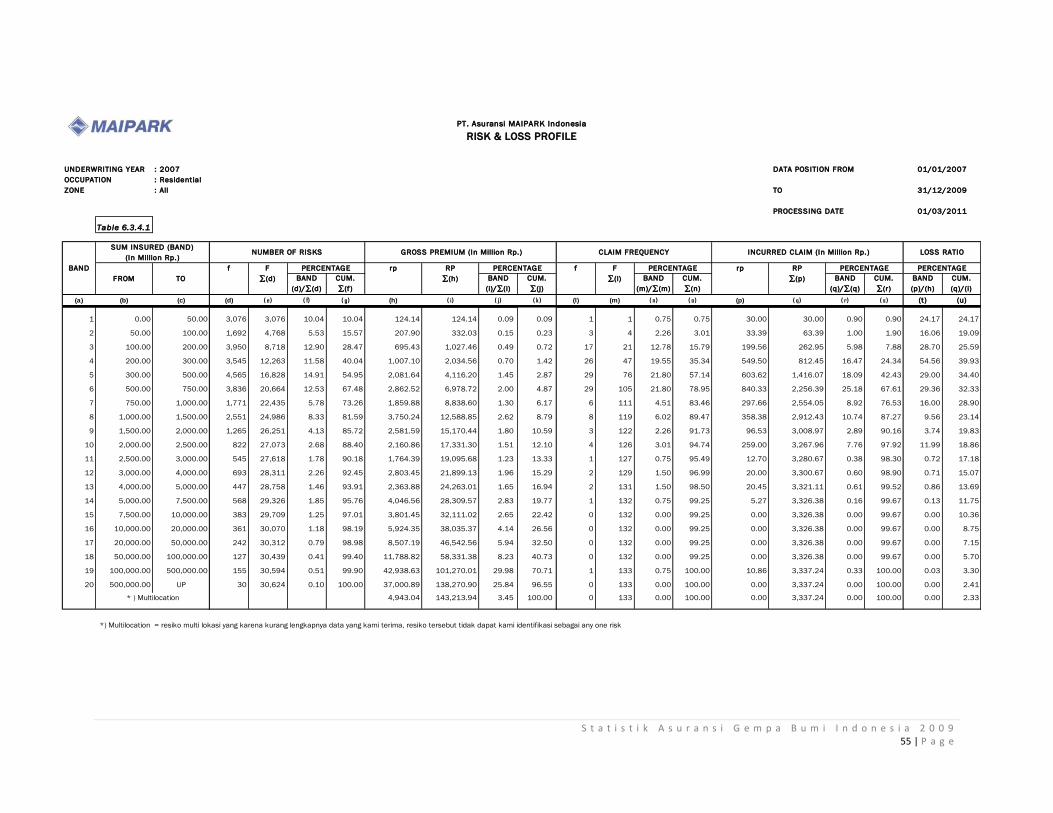
S t a t i s t i k A s u r a n s i G e m p a B u m i I n d o n e s i a 2 0 0 9 55 | P a g e
UNDERWRITING YEAR : 2007 DATA POSITION FROM
OCCUPATION : Residential
ZONE : All TO
PROCESSING DATE
Table 6.3.4.1
BAND
(d)/∑(d)
CUM.
∑(f)
BAND
(i)/∑(i)
CUM.
∑(j)
BAND
(m)/∑(m)
CUM.
∑(n)
BAND
(q)/∑(q)
CUM.
∑(r)
BAND
(p)/(h)
CUM.
(q)/(i)
(a) (b) (c) (d) ( e) ( f) ( g) (h) ( i) ( j) ( k) (l) (m) ( n) ( o) (p) ( q) ( r) ( s) (t ) (u)
1 0.00 50.00 3,076 3,076 10.04 10.04 124.14 124.14 0.09 0.09 1 1 0.75 0.75 30.00 30.00 0.90 0.90 24.17 24.17
2 50.00 100.00 1,692 4,768 5.53 15.57 207.90 332.03 0.15 0.23 3 4 2.26 3.01 33.39 63.39 1.00 1.90 16.06 19.09
3 100.00 200.00 3,950 8,718 12.90 28.47 695.43 1,027.46 0.49 0.72 17 21 12.78 15.79 199.56 262.95 5.98 7.88 28.70 25.59
4 200.00 300.00 3,545 12,263 11.58 40.04 1,007.10 2,034.56 0.70 1.42 26 47 19.55 35.34 549.50 812.45 16.47 24.34 54.56 39.93
5 300.00 500.00 4,565 16,828 14.91 54.95 2,081.64 4,116.20 1.45 2.87 29 76 21.80 57.14 603.62 1,416.07 18.09 42.43 29.00 34.40
6 500.00 750.00 3,836 20,664 12.53 67.48 2,862.52 6,978.72 2.00 4.87 29 105 21.80 78.95 840.33 2,256.39 25.18 67.61 29.36 32.33
7 750.00 1,000.00 1,771 22,435 5.78 73.26 1,859.88 8,838.60 1.30 6.17 6 111 4.51 83.46 297.66 2,554.05 8.92 76.53 16.00 28.90
8 1,000.00 1,500.00 2,551 24,986 8.33 81.59 3,750.24 12,588.85 2.62 8.79 8 119 6.02 89.47 358.38 2,912.43 10.74 87.27 9.56 23.14
9 1,500.00 2,000.00 1,265 26,251 4.13 85.72 2,581.59 15,170.44 1.80 10.59 3 122 2.26 91.73 96.53 3,008.97 2.89 90.16 3.74 19.83
10 2,000.00 2,500.00 822 27,073 2.68 88.40 2,160.86 17,331.30 1.51 12.10 4 126 3.01 94.74 259.00 3,267.96 7.76 97.92 11.99 18.86
11 2,500.00 3,000.00 545 27,618 1.78 90.18 1,764.39 19,095.68 1.23 13.33 1 127 0.75 95.49 12.70 3,280.67 0.38 98.30 0.72 17.18
12 3,000.00 4,000.00 693 28,311 2.26 92.45 2,803.45 21,899.13 1.96 15.29 2 129 1.50 96.99 20.00 3,300.67 0.60 98.90 0.71 15.07
13 4,000.00 5,000.00 447 28,758 1.46 93.91 2,363.88 24,263.01 1.65 16.94 2 131 1.50 98.50 20.45 3,321.11 0.61 99.52 0.86 13.69
14 5,000.00 7,500.00 568 29,326 1.85 95.76 4,046.56 28,309.57 2.83 19.77 1 132 0.75 99.25 5.27 3,326.38 0.16 99.67 0.13 11.75
15 7,500.00 10,000.00 383 29,709 1.25 97.01 3,801.45 32,111.02 2.65 22.42 0 132 0.00 99.25 0.00 3,326.38 0.00 99.67 0.00 10.36
16 10,000.00 20,000.00 361 30,070 1.18 98.19 5,924.35 38,035.37 4.14 26.56 0 132 0.00 99.25 0.00 3,326.38 0.00 99.67 0.00 8.75
17 20,000.00 50,000.00 242 30,312 0.79 98.98 8,507.19 46,542.56 5.94 32.50 0 132 0.00 99.25 0.00 3,326.38 0.00 99.67 0.00 7.15
18 50,000.00 100,000.00 127 30,439 0.41 99.40 11,788.82 58,331.38 8.23 40.73 0 132 0.00 99.25 0.00 3,326.38 0.00 99.67 0.00 5.70
19 100,000.00 500,000.00 155 30,594 0.51 99.90 42,938.63 101,270.01 29.98 70.71 1 133 0.75 100.00 10.86 3,337.24 0.33 100.00 0.03 3.30
20 500,000.00 UP 30 30,624 0.10 100.00 37,000.89 138,270.90 25.84 96.55 0 133 0.00 100.00 0.00 3,337.24 0.00 100.00 0.00 2.41
4,943.04 143,213.94 3.45 100.00 0 133 0.00 100.00 0.00 3,337.24 0.00 100.00 0.00 2.33
*) Multilocation = resiko multi lokasi yang karena kurang lengkapnya data yang kami terima, resiko tersebut tidak dapat kami identifikasi sebagai any one risk
* ) Multilocation
FROM TO
PERCENTAGEPERCENTAGE PERCENTAGE F
∑(l)
RP
∑(h)
CLAIM FREQUENCY LOSS RATIO
BAND f F
∑(d)
SUM INSURED (BAND)
(In Million Rp.)
rp
GROSS PREMIUM (In Million Rp.)
PERCENTAGE
NUMBER OF RISKS
f PERCENTAGE RP
∑(p)
rp
INCURRED CLAIM (In Million Rp.)
31/12/2009
01/03/2011
01/01/2007
PT. Asuransi MAIPARK Indonesia
RISK & LOSS PROFILE
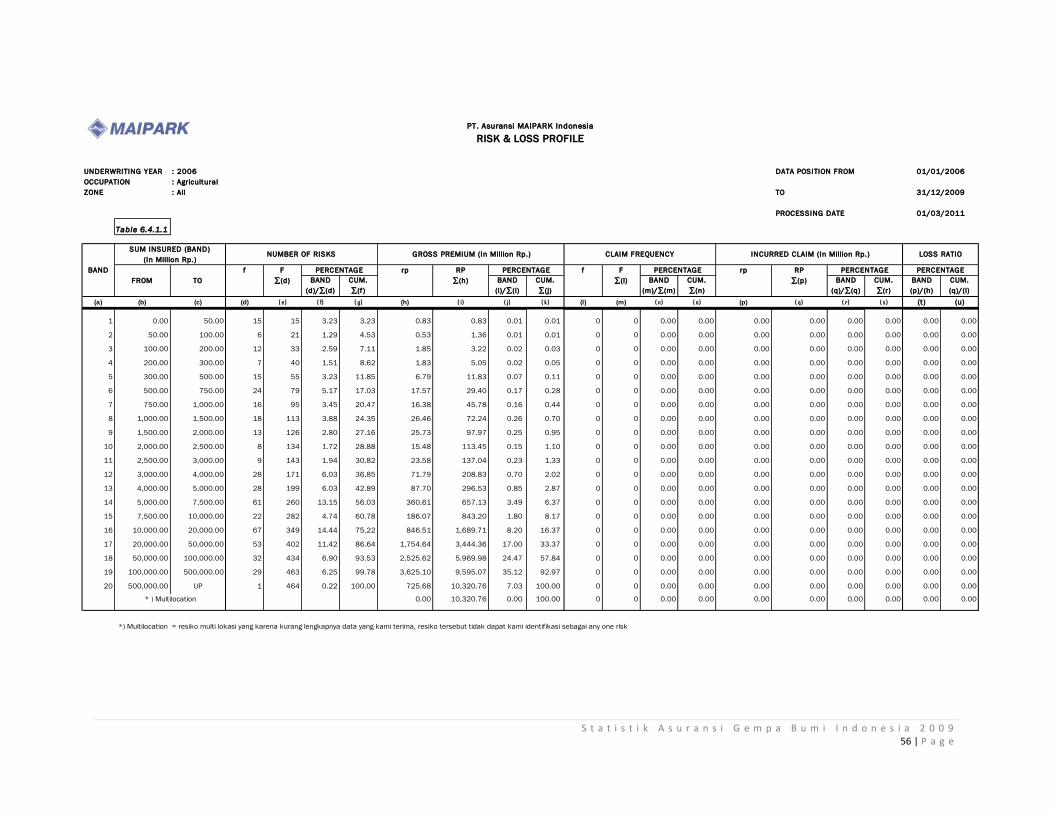
S t a t i s t i k A s u r a n s i G e m p a B u m i I n d o n e s i a 2 0 0 9 56 | P a g e
UNDERWRITING YEAR : 2006 DATA POSITION FROM
OCCUPATION : Agricultural
ZONE : All TO
PROCESSING DATE
Table 6.4.1.1
BAND
(d)/∑(d)
CUM.
∑(f)
BAND
(i)/∑(i)
CUM.
∑(j)
BAND
(m)/∑(m)
CUM.
∑(n)
BAND
(q)/∑(q)
CUM.
∑(r)
BAND
(p)/(h)
CUM.
(q)/(i)
(a) (b) (c) (d) ( e) ( f) ( g) (h) ( i) ( j) ( k) (l) (m) ( n) ( o) (p) ( q) ( r) ( s) (t ) (u)
1 0.00 50.00 15 15 3.23 3.23 0.83 0.83 0.01 0.01 0 0 0.00 0.00 0.00 0.00 0.00 0.00 0.00 0.00
2 50.00 100.00 6 21 1.29 4.53 0.53 1.36 0.01 0.01 0 0 0.00 0.00 0.00 0.00 0.00 0.00 0.00 0.00
3 100.00 200.00 12 33 2.59 7.11 1.85 3.22 0.02 0.03 0 0 0.00 0.00 0.00 0.00 0.00 0.00 0.00 0.00
4 200.00 300.00 7 40 1.51 8.62 1.83 5.05 0.02 0.05 0 0 0.00 0.00 0.00 0.00 0.00 0.00 0.00 0.00
5 300.00 500.00 15 55 3.23 11.85 6.79 11.83 0.07 0.11 0 0 0.00 0.00 0.00 0.00 0.00 0.00 0.00 0.00
6 500.00 750.00 24 79 5.17 17.03 17.57 29.40 0.17 0.28 0 0 0.00 0.00 0.00 0.00 0.00 0.00 0.00 0.00
7 750.00 1,000.00 16 95 3.45 20.47 16.38 45.78 0.16 0.44 0 0 0.00 0.00 0.00 0.00 0.00 0.00 0.00 0.00
8 1,000.00 1,500.00 18 113 3.88 24.35 26.46 72.24 0.26 0.70 0 0 0.00 0.00 0.00 0.00 0.00 0.00 0.00 0.00
9 1,500.00 2,000.00 13 126 2.80 27.16 25.73 97.97 0.25 0.95 0 0 0.00 0.00 0.00 0.00 0.00 0.00 0.00 0.00
10 2,000.00 2,500.00 8 134 1.72 28.88 15.48 113.45 0.15 1.10 0 0 0.00 0.00 0.00 0.00 0.00 0.00 0.00 0.00
11 2,500.00 3,000.00 9 143 1.94 30.82 23.58 137.04 0.23 1.33 0 0 0.00 0.00 0.00 0.00 0.00 0.00 0.00 0.00
12 3,000.00 4,000.00 28 171 6.03 36.85 71.79 208.83 0.70 2.02 0 0 0.00 0.00 0.00 0.00 0.00 0.00 0.00 0.00
13 4,000.00 5,000.00 28 199 6.03 42.89 87.70 296.53 0.85 2.87 0 0 0.00 0.00 0.00 0.00 0.00 0.00 0.00 0.00
14 5,000.00 7,500.00 61 260 13.15 56.03 360.61 657.13 3.49 6.37 0 0 0.00 0.00 0.00 0.00 0.00 0.00 0.00 0.00
15 7,500.00 10,000.00 22 282 4.74 60.78 186.07 843.20 1.80 8.17 0 0 0.00 0.00 0.00 0.00 0.00 0.00 0.00 0.00
16 10,000.00 20,000.00 67 349 14.44 75.22 846.51 1,689.71 8.20 16.37 0 0 0.00 0.00 0.00 0.00 0.00 0.00 0.00 0.00
17 20,000.00 50,000.00 53 402 11.42 86.64 1,754.64 3,444.36 17.00 33.37 0 0 0.00 0.00 0.00 0.00 0.00 0.00 0.00 0.00
18 50,000.00 100,000.00 32 434 6.90 93.53 2,525.62 5,969.98 24.47 57.84 0 0 0.00 0.00 0.00 0.00 0.00 0.00 0.00 0.00
19 100,000.00 500,000.00 29 463 6.25 99.78 3,625.10 9,595.07 35.12 92.97 0 0 0.00 0.00 0.00 0.00 0.00 0.00 0.00 0.00
20 500,000.00 UP 1 464 0.22 100.00 725.68 10,320.76 7.03 100.00 0 0 0.00 0.00 0.00 0.00 0.00 0.00 0.00 0.00
0.00 10,320.76 0.00 100.00 0 0 0.00 0.00 0.00 0.00 0.00 0.00 0.00 0.00
*) Multilocation = resiko multi lokasi yang karena kurang lengkapnya data yang kami terima, resiko tersebut tidak dapat kami identifikasi sebagai any one risk
PT. Asuransi MAIPARK Indonesia
RISK & LOSS PROFILE
CLAIM FREQUENCY LOSS RATIO
BAND f F
∑(d)
SUM INSURED (BAND)
(In Million Rp.)
rp
GROSS PREMIUM (In Million Rp.)
PERCENTAGE
NUMBER OF RISKS
f PERCENTAGE RP
∑(p)
rp
* ) Multilocation
PERCENTAGE
31/12/2009
01/03/2011
01/01/2006
FROM TO
PERCENTAGE PERCENTAGE F
∑(l)
RP
∑(h)
INCURRED CLAIM (In Million Rp.)

S t a t i s t i k A s u r a n s i G e m p a B u m i I n d o n e s i a 2 0 0 9 57 | P a g e
UNDERWRITING YEAR : 2006 DATA POSITION FROM
OCCUPATION : Commercial
ZONE : All TO
PROCESSING DATE
Table 6.4.2.1
BAND
(d)/∑(d)
CUM.
∑(f)
BAND
(i)/∑(i)
CUM.
∑(j)
BAND
(m)/∑(m)
CUM.
∑(n)
BAND
(q)/∑(q)
CUM.
∑(r)
BAND
(p)/(h)
CUM.
(q)/(i)
(a) (b) (c) (d) ( e) ( f) ( g) (h) ( i) ( j) ( k) (l) (m) ( n) ( o) (p) ( q) ( r) ( s) (t ) (u)
1 0.00 50.00 6,956 6,956 18.26 18.26 1,728.52 1,728.52 0.40 0.40 12 12 3.90 3.90 237.01 237.01 0.38 0.38 13.71 13.71
2 50.00 100.00 2,149 9,105 5.64 23.91 220.15 1,948.67 0.05 0.46 16 28 5.19 9.09 392.19 629.20 0.63 1.00 178.15 32.29
3 100.00 200.00 3,293 12,398 8.65 32.55 536.13 2,484.80 0.13 0.58 19 47 6.17 15.26 539.19 1,168.38 0.86 1.86 100.57 47.02
4 200.00 300.00 2,533 14,931 6.65 39.21 680.02 3,164.81 0.16 0.74 18 65 5.84 21.10 548.95 1,717.34 0.88 2.74 80.73 54.26
5 300.00 500.00 3,757 18,688 9.87 49.07 1,623.05 4,787.86 0.38 1.12 39 104 12.66 33.77 1,871.64 3,588.97 2.98 5.72 115.32 74.96
6 500.00 750.00 3,561 22,249 9.35 58.42 2,391.43 7,179.29 0.56 1.68 39 143 12.66 46.43 2,442.30 6,031.28 3.89 9.62 102.13 84.01
7 750.00 1,000.00 1,908 24,157 5.01 63.43 1,816.19 8,995.48 0.42 2.10 26 169 8.44 54.87 1,444.60 7,475.88 2.30 11.92 79.54 83.11
8 1,000.00 1,500.00 3,268 27,425 8.58 72.01 4,278.31 13,273.79 1.00 3.10 21 190 6.82 61.69 1,627.80 9,103.68 2.60 14.52 38.05 68.58
9 1,500.00 2,000.00 1,713 29,138 4.50 76.51 3,154.70 16,428.49 0.74 3.84 9 199 2.92 64.61 667.97 9,771.65 1.07 15.58 21.17 59.48
10 2,000.00 2,500.00 1,350 30,488 3.54 80.05 3,229.00 19,657.49 0.76 4.60 11 210 3.57 68.18 2,713.06 12,484.71 4.33 19.91 84.02 63.51
11 2,500.00 3,000.00 840 31,328 2.21 82.26 2,468.64 22,126.13 0.58 5.17 7 217 2.27 70.45 943.16 13,427.87 1.50 21.41 38.21 60.69
12 3,000.00 4,000.00 1,294 32,622 3.40 85.66 4,851.12 26,977.25 1.13 6.31 10 227 3.25 73.70 1,064.28 14,492.15 1.70 23.11 21.94 53.72
13 4,000.00 5,000.00 825 33,447 2.17 87.82 4,058.35 31,035.60 0.95 7.26 13 240 4.22 77.92 1,471.17 15,963.33 2.35 25.45 36.25 51.44
14 5,000.00 7,500.00 1,284 34,731 3.37 91.20 8,296.06 39,331.66 1.94 9.20 8 248 2.60 80.52 4,937.00 20,900.33 7.87 33.33 59.51 53.14
15 7,500.00 10,000.00 637 35,368 1.67 92.87 5,918.23 45,249.89 1.38 10.58 8 256 2.60 83.12 1,616.29 22,516.61 2.58 35.90 27.31 49.76
16 10,000.00 20,000.00 1,165 36,533 3.06 95.93 16,775.29 62,025.18 3.92 14.51 11 267 3.57 86.69 6,524.42 29,041.03 10.40 46.31 38.89 46.82
17 20,000.00 50,000.00 801 37,334 2.10 98.03 26,232.05 88,257.22 6.13 20.64 10 277 3.25 89.94 4,260.22 33,301.26 6.79 53.10 16.24 37.73
18 50,000.00 100,000.00 319 37,653 0.84 98.87 24,310.48 112,567.70 5.69 26.33 11 288 3.57 93.51 7,048.45 40,349.71 11.24 64.34 28.99 35.84
19 100,000.00 500,000.00 360 38,013 0.95 99.81 85,213.87 197,781.57 19.93 46.25 13 301 4.22 97.73 9,947.36 50,297.07 15.86 80.20 11.67 25.43
20 500,000.00 UP 71 38,084 0.19 100.00 118,440.53 316,222.10 27.70 73.95 4 305 1.30 99.03 46.88 50,343.95 0.07 80.28 0.04 15.92
111,380.58 427,602.68 26.05 100.00 3 308 0.97 100.00 12,370.41 62,714.36 19.72 100.00 11.11 14.67
*) Multilocation = resiko multi lokasi yang karena kurang lengkapnya data yang kami terima, resiko tersebut tidak dapat kami identifikasi sebagai any one risk
INCURRED CLAIM (In Million Rp.)
31/12/2009
01/03/2011
01/01/2006
* ) Multilocation
FROM TO
PERCENTAGEPERCENTAGE PERCENTAGE F
∑(l)
RP
∑(h)
PT. Asuransi MAIPARK Indonesia
RISK & LOSS PROFILE
CLAIM FREQUENCY LOSS RATIO
f F
∑(d)
rp
GROSS PREMIUM (In Million Rp.)
PERCENTAGE
NUMBER OF RISKS
BAND
SUM INSURED (BAND)
(In Million Rp.)
f PERCENTAGE RP
∑(p)
rp
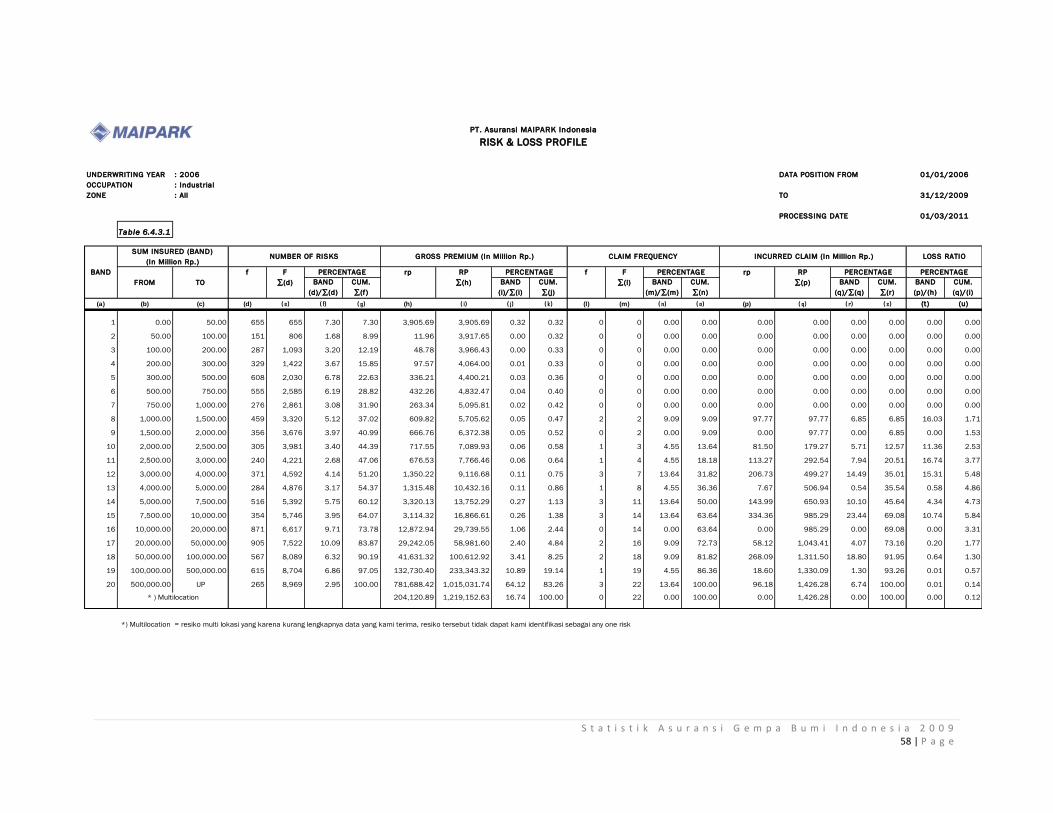
S t a t i s t i k A s u r a n s i G e m p a B u m i I n d o n e s i a 2 0 0 9 58 | P a g e
UNDERWRITING YEAR : 2006 DATA POSITION FROM
OCCUPATION : Industrial
ZONE : All TO
PROCESSING DATE
Table 6.4.3.1
BAND
(d)/∑(d)
CUM.
∑(f)
BAND
(i)/∑(i)
CUM.
∑(j)
BAND
(m)/∑(m)
CUM.
∑(n)
BAND
(q)/∑(q)
CUM.
∑(r)
BAND
(p)/(h)
CUM.
(q)/(i)
(a) (b) (c) (d) ( e) ( f) ( g) (h) ( i) ( j) ( k) (l) (m) ( n) ( o) (p) ( q) ( r) ( s) (t ) (u)
1 0.00 50.00 655 655 7.30 7.30 3,905.69 3,905.69 0.32 0.32 0 0 0.00 0.00 0.00 0.00 0.00 0.00 0.00 0.00
2 50.00 100.00 151 806 1.68 8.99 11.96 3,917.65 0.00 0.32 0 0 0.00 0.00 0.00 0.00 0.00 0.00 0.00 0.00
3 100.00 200.00 287 1,093 3.20 12.19 48.78 3,966.43 0.00 0.33 0 0 0.00 0.00 0.00 0.00 0.00 0.00 0.00 0.00
4 200.00 300.00 329 1,422 3.67 15.85 97.57 4,064.00 0.01 0.33 0 0 0.00 0.00 0.00 0.00 0.00 0.00 0.00 0.00
5 300.00 500.00 608 2,030 6.78 22.63 336.21 4,400.21 0.03 0.36 0 0 0.00 0.00 0.00 0.00 0.00 0.00 0.00 0.00
6 500.00 750.00 555 2,585 6.19 28.82 432.26 4,832.47 0.04 0.40 0 0 0.00 0.00 0.00 0.00 0.00 0.00 0.00 0.00
7 750.00 1,000.00 276 2,861 3.08 31.90 263.34 5,095.81 0.02 0.42 0 0 0.00 0.00 0.00 0.00 0.00 0.00 0.00 0.00
8 1,000.00 1,500.00 459 3,320 5.12 37.02 609.82 5,705.62 0.05 0.47 2 2 9.09 9.09 97.77 97.77 6.85 6.85 16.03 1.71
9 1,500.00 2,000.00 356 3,676 3.97 40.99 666.76 6,372.38 0.05 0.52 0 2 0.00 9.09 0.00 97.77 0.00 6.85 0.00 1.53
10 2,000.00 2,500.00 305 3,981 3.40 44.39 717.55 7,089.93 0.06 0.58 1 3 4.55 13.64 81.50 179.27 5.71 12.57 11.36 2.53
11 2,500.00 3,000.00 240 4,221 2.68 47.06 676.53 7,766.46 0.06 0.64 1 4 4.55 18.18 113.27 292.54 7.94 20.51 16.74 3.77
12 3,000.00 4,000.00 371 4,592 4.14 51.20 1,350.22 9,116.68 0.11 0.75 3 7 13.64 31.82 206.73 499.27 14.49 35.01 15.31 5.48
13 4,000.00 5,000.00 284 4,876 3.17 54.37 1,315.48 10,432.16 0.11 0.86 1 8 4.55 36.36 7.67 506.94 0.54 35.54 0.58 4.86
14 5,000.00 7,500.00 516 5,392 5.75 60.12 3,320.13 13,752.29 0.27 1.13 3 11 13.64 50.00 143.99 650.93 10.10 45.64 4.34 4.73
15 7,500.00 10,000.00 354 5,746 3.95 64.07 3,114.32 16,866.61 0.26 1.38 3 14 13.64 63.64 334.36 985.29 23.44 69.08 10.74 5.84
16 10,000.00 20,000.00 871 6,617 9.71 73.78 12,872.94 29,739.55 1.06 2.44 0 14 0.00 63.64 0.00 985.29 0.00 69.08 0.00 3.31
17 20,000.00 50,000.00 905 7,522 10.09 83.87 29,242.05 58,981.60 2.40 4.84 2 16 9.09 72.73 58.12 1,043.41 4.07 73.16 0.20 1.77
18 50,000.00 100,000.00 567 8,089 6.32 90.19 41,631.32 100,612.92 3.41 8.25 2 18 9.09 81.82 268.09 1,311.50 18.80 91.95 0.64 1.30
19 100,000.00 500,000.00 615 8,704 6.86 97.05 132,730.40 233,343.32 10.89 19.14 1 19 4.55 86.36 18.60 1,330.09 1.30 93.26 0.01 0.57
20 500,000.00 UP 265 8,969 2.95 100.00 781,688.42 1,015,031.74 64.12 83.26 3 22 13.64 100.00 96.18 1,426.28 6.74 100.00 0.01 0.14
204,120.89 1,219,152.63 16.74 100.00 0 22 0.00 100.00 0.00 1,426.28 0.00 100.00 0.00 0.12
*) Multilocation = resiko multi lokasi yang karena kurang lengkapnya data yang kami terima, resiko tersebut tidak dapat kami identifikasi sebagai any one risk
PT. Asuransi MAIPARK Indonesia
RISK & LOSS PROFILE
CLAIM FREQUENCY LOSS RATIO
BAND f F
∑(d)
SUM INSURED (BAND)
(In Million Rp.)
rp
GROSS PREMIUM (In Million Rp.)
PERCENTAGE
NUMBER OF RISKS
f PERCENTAGE RP
∑(p)
rp
* ) Multilocation
PERCENTAGE
01/01/2006
FROM TO
PERCENTAGE PERCENTAGE F
∑(l)
RP
∑(h)
INCURRED CLAIM (In Million Rp.)
31/12/2009
01/03/2011
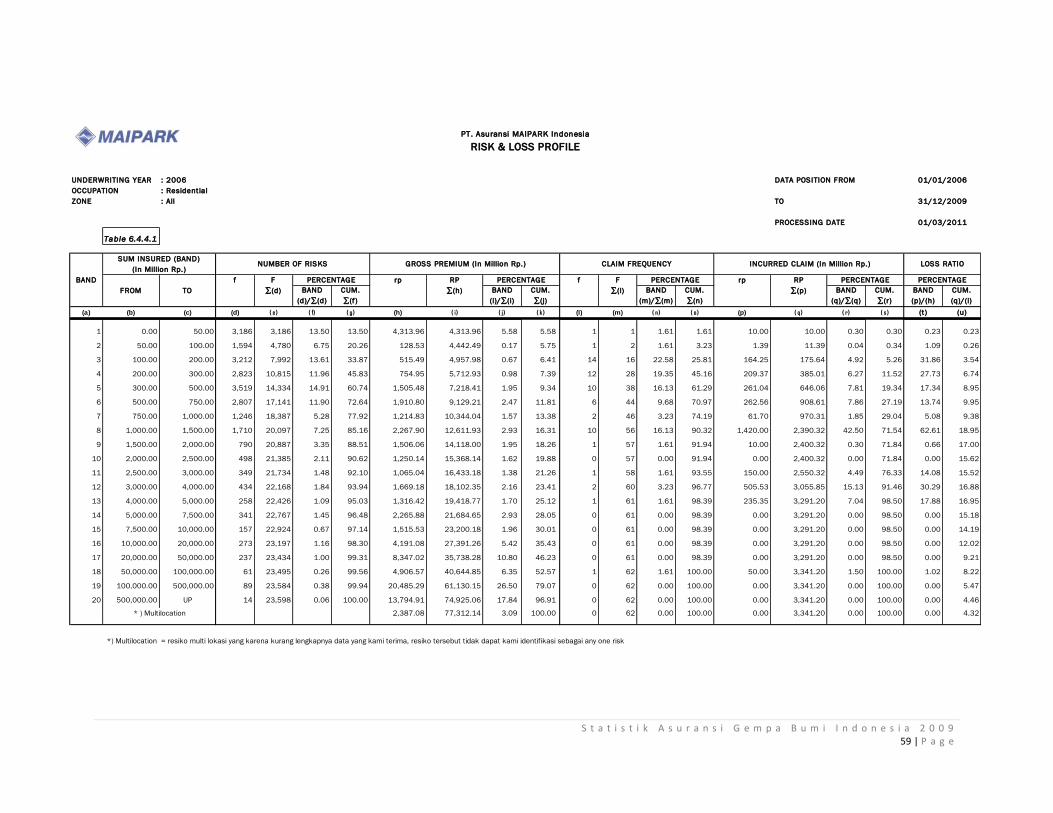
S t a t i s t i k A s u r a n s i G e m p a B u m i I n d o n e s i a 2 0 0 9 59 | P a g e
UNDERWRITING YEAR : 2006 DATA POSITION FROM
OCCUPATION : Residential
ZONE : All TO
PROCESSING DATE
Table 6.4.4.1
BAND
(d)/∑(d)
CUM.
∑(f)
BAND
(i)/∑(i)
CUM.
∑(j)
BAND
(m)/∑(m)
CUM.
∑(n)
BAND
(q)/∑(q)
CUM.
∑(r)
BAND
(p)/(h)
CUM.
(q)/(i)
(a) (b) (c) (d) ( e) ( f) ( g) (h) ( i) ( j) ( k) (l) (m) ( n) ( o) (p) ( q) ( r) ( s) (t ) (u)
1 0.00 50.00 3,186 3,186 13.50 13.50 4,313.96 4,313.96 5.58 5.58 1 1 1.61 1.61 10.00 10.00 0.30 0.30 0.23 0.23
2 50.00 100.00 1,594 4,780 6.75 20.26 128.53 4,442.49 0.17 5.75 1 2 1.61 3.23 1.39 11.39 0.04 0.34 1.09 0.26
3 100.00 200.00 3,212 7,992 13.61 33.87 515.49 4,957.98 0.67 6.41 14 16 22.58 25.81 164.25 175.64 4.92 5.26 31.86 3.54
4 200.00 300.00 2,823 10,815 11.96 45.83 754.95 5,712.93 0.98 7.39 12 28 19.35 45.16 209.37 385.01 6.27 11.52 27.73 6.74
5 300.00 500.00 3,519 14,334 14.91 60.74 1,505.48 7,218.41 1.95 9.34 10 38 16.13 61.29 261.04 646.06 7.81 19.34 17.34 8.95
6 500.00 750.00 2,807 17,141 11.90 72.64 1,910.80 9,129.21 2.47 11.81 6 44 9.68 70.97 262.56 908.61 7.86 27.19 13.74 9.95
7 750.00 1,000.00 1,246 18,387 5.28 77.92 1,214.83 10,344.04 1.57 13.38 2 46 3.23 74.19 61.70 970.31 1.85 29.04 5.08 9.38
8 1,000.00 1,500.00 1,710 20,097 7.25 85.16 2,267.90 12,611.93 2.93 16.31 10 56 16.13 90.32 1,420.00 2,390.32 42.50 71.54 62.61 18.95
9 1,500.00 2,000.00 790 20,887 3.35 88.51 1,506.06 14,118.00 1.95 18.26 1 57 1.61 91.94 10.00 2,400.32 0.30 71.84 0.66 17.00
10 2,000.00 2,500.00 498 21,385 2.11 90.62 1,250.14 15,368.14 1.62 19.88 0 57 0.00 91.94 0.00 2,400.32 0.00 71.84 0.00 15.62
11 2,500.00 3,000.00 349 21,734 1.48 92.10 1,065.04 16,433.18 1.38 21.26 1 58 1.61 93.55 150.00 2,550.32 4.49 76.33 14.08 15.52
12 3,000.00 4,000.00 434 22,168 1.84 93.94 1,669.18 18,102.35 2.16 23.41 2 60 3.23 96.77 505.53 3,055.85 15.13 91.46 30.29 16.88
13 4,000.00 5,000.00 258 22,426 1.09 95.03 1,316.42 19,418.77 1.70 25.12 1 61 1.61 98.39 235.35 3,291.20 7.04 98.50 17.88 16.95
14 5,000.00 7,500.00 341 22,767 1.45 96.48 2,265.88 21,684.65 2.93 28.05 0 61 0.00 98.39 0.00 3,291.20 0.00 98.50 0.00 15.18
15 7,500.00 10,000.00 157 22,924 0.67 97.14 1,515.53 23,200.18 1.96 30.01 0 61 0.00 98.39 0.00 3,291.20 0.00 98.50 0.00 14.19
16 10,000.00 20,000.00 273 23,197 1.16 98.30 4,191.08 27,391.26 5.42 35.43 0 61 0.00 98.39 0.00 3,291.20 0.00 98.50 0.00 12.02
17 20,000.00 50,000.00 237 23,434 1.00 99.31 8,347.02 35,738.28 10.80 46.23 0 61 0.00 98.39 0.00 3,291.20 0.00 98.50 0.00 9.21
18 50,000.00 100,000.00 61 23,495 0.26 99.56 4,906.57 40,644.85 6.35 52.57 1 62 1.61 100.00 50.00 3,341.20 1.50 100.00 1.02 8.22
19 100,000.00 500,000.00 89 23,584 0.38 99.94 20,485.29 61,130.15 26.50 79.07 0 62 0.00 100.00 0.00 3,341.20 0.00 100.00 0.00 5.47
20 500,000.00 UP 14 23,598 0.06 100.00 13,794.91 74,925.06 17.84 96.91 0 62 0.00 100.00 0.00 3,341.20 0.00 100.00 0.00 4.46
2,387.08 77,312.14 3.09 100.00 0 62 0.00 100.00 0.00 3,341.20 0.00 100.00 0.00 4.32
*) Multilocation = resiko multi lokasi yang karena kurang lengkapnya data yang kami terima, resiko tersebut tidak dapat kami identifikasi sebagai any one risk
INCURRED CLAIM (In Million Rp.)
31/12/2009
01/03/2011
01/01/2006
* ) Multilocation
FROM TO
PERCENTAGEPERCENTAGE PERCENTAGE F
∑(l)
RP
∑(h)
PT. Asuransi MAIPARK Indonesia
RISK & LOSS PROFILE
CLAIM FREQUENCY LOSS RATIO
f F
∑(d)
rp
GROSS PREMIUM (In Million Rp.)
PERCENTAGE
NUMBER OF RISKS
BAND
SUM INSURED (BAND)
(In Million Rp.)
f PERCENTAGE RP
∑(p)
rp

S t a t i s t i k A s u r a n s i G e m p a B u m i I n d o n e s i a 2 0 0 9 60 | P a g e
Peta 7.1 / Map 7.1
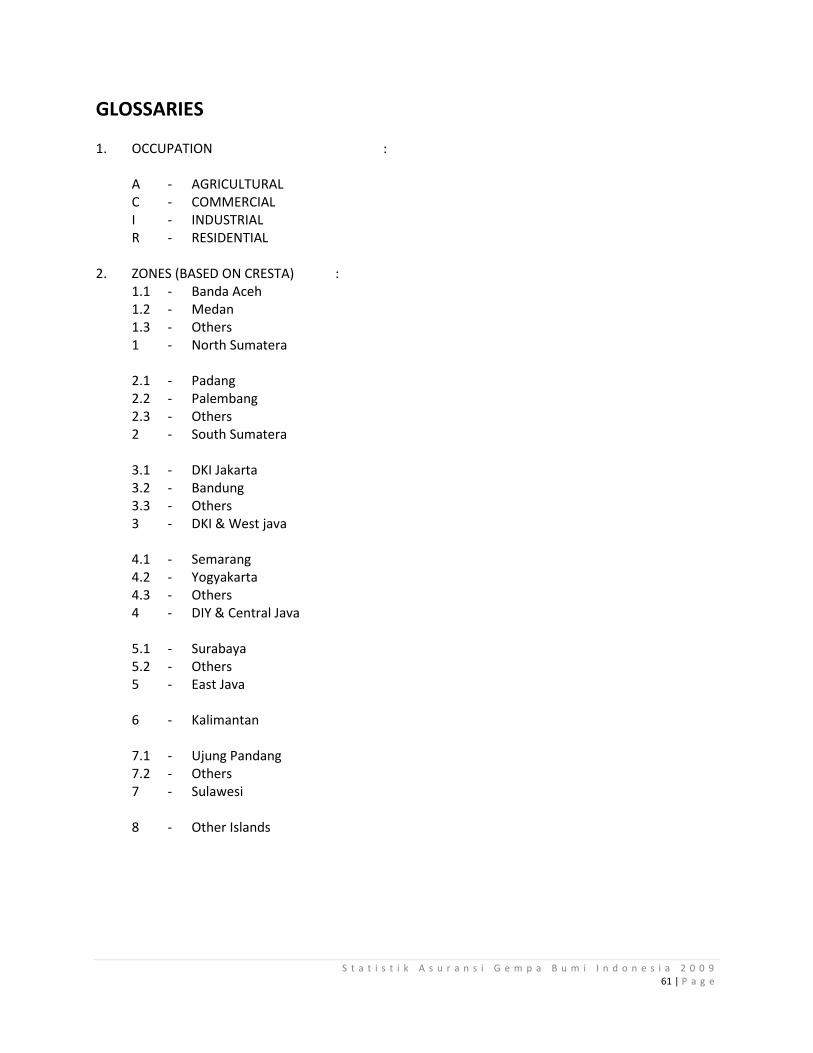
S t a t i s t i k A s u r a n s i G e m p a B u m i I n d o n e s i a 2 0 0 9 61 | P a g e
GLOSSARIES 1. OCCUPATION :
A - AGRICULTURAL C - COMMERCIAL I - INDUSTRIAL R - RESIDENTIAL
2. ZONES (BASED ON CRESTA) : 1.1 - Banda Aceh 1.2 - Medan 1.3 - Others 1 - North Sumatera 2.1 - Padang 2.2 - Palembang 2.3 - Others 2 - South Sumatera 3.1 - DKI Jakarta 3.2 - Bandung 3.3 - Others 3 - DKI & West java 4.1 - Semarang 4.2 - Yogyakarta 4.3 - Others 4 - DIY & Central Java 5.1 - Surabaya 5.2 - Others 5 - East Java 6 - Kalimantan 7.1 - Ujung Pandang 7.2 - Others 7 - Sulawesi 8 - Other Islands
S t a t i s t i k A s u r a n s i G e m p a B u m i I n d o n e s i a 2 0 0 9 62 | P a g e
3. f : Frequencies F : Accumulations of frequencies Cum : Cumulative (increasing in amount by one addition after another) 4. Incurred Claim
Outstanding Claims (100%) plus paid/settled claims (100%)
5. Sum Insured The Sum Insured represents 100% Sum Insured 6. Gross Premium Gross Premium represent 100% premium 7. Loss Ratio The percentage ratio of Incurred claims to Gross Premium
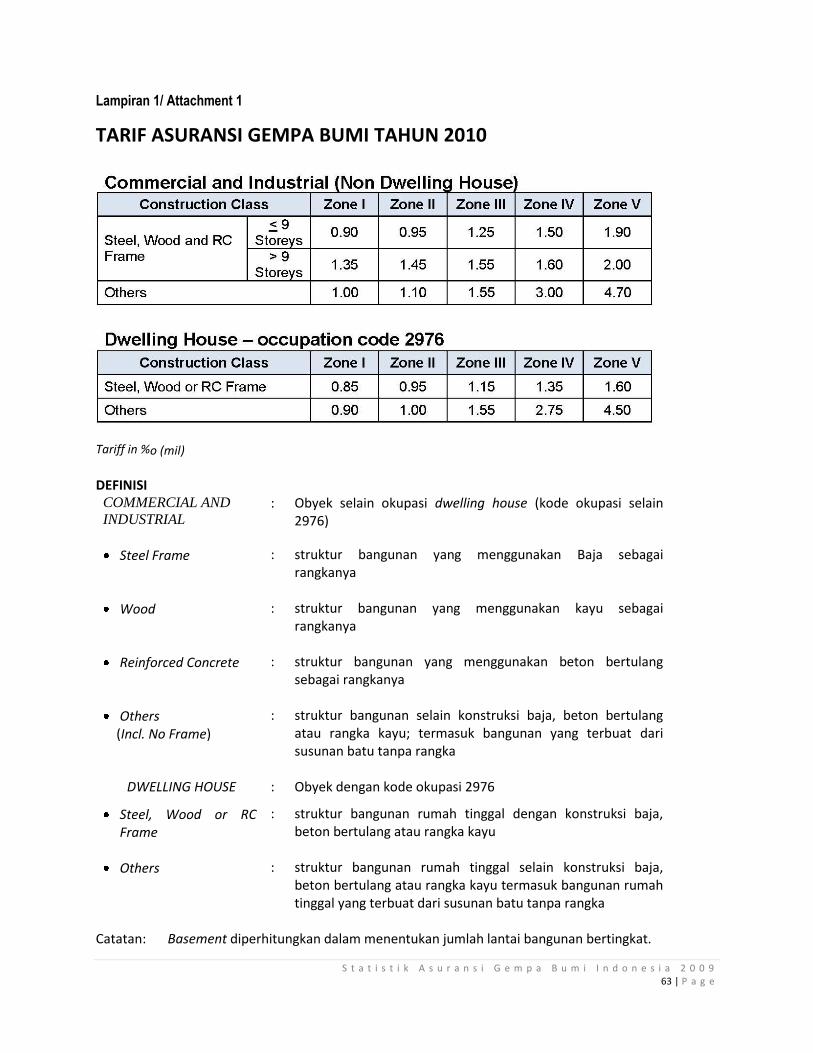
S t a t i s t i k A s u r a n s i G e m p a B u m i I n d o n e s i a 2 0 0 9 63 | P a g e
TARIF ASURANSI GEMPA BUMI TAHUN 2010
Tariff in %o (mil)
DEFINISI COMMERCIAL AND
INDUSTRIAL :
: Obyek selain okupasi dwelling house (kode okupasi selain 2976)
Steel Frame : struktur bangunan yang menggunakan Baja sebagai rangkanya
Wood : struktur bangunan yang menggunakan kayu sebagai rangkanya
Reinforced Concrete : struktur bangunan yang menggunakan beton bertulang sebagai rangkanya
Others (Incl. No Frame)
: struktur bangunan selain konstruksi baja, beton bertulang atau rangka kayu; termasuk bangunan yang terbuat dari susunan batu tanpa rangka
DWELLING HOUSE : Obyek dengan kode okupasi 2976
Steel, Wood or RC Frame
: struktur bangunan rumah tinggal dengan konstruksi baja, beton bertulang atau rangka kayu
Others : struktur bangunan rumah tinggal selain konstruksi baja, beton bertulang atau rangka kayu termasuk bangunan rumah tinggal yang terbuat dari susunan batu tanpa rangka
Catatan: Basement diperhitungkan dalam menentukan jumlah lantai bangunan bertingkat.
Lampiran 1/ Attachment 1
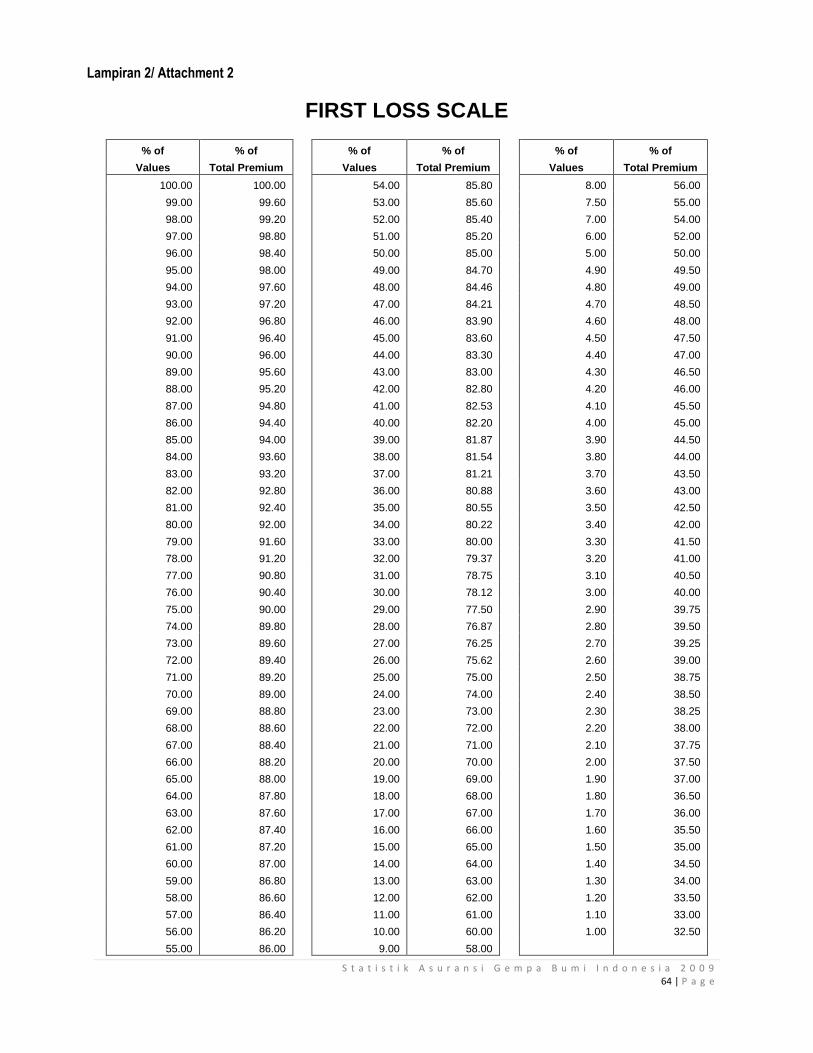
S t a t i s t i k A s u r a n s i G e m p a B u m i I n d o n e s i a 2 0 0 9 64 | P a g e
FIRST LOSS SCALE
% of % of % of % of % of % of
Values Total Premium Values Total Premium Values Total Premium
100.00 100.00 54.00 85.80 8.00 56.00
99.00 99.60 53.00 85.60 7.50 55.00
98.00 99.20 52.00 85.40 7.00 54.00
97.00 98.80 51.00 85.20 6.00 52.00
96.00 98.40 50.00 85.00 5.00 50.00
95.00 98.00 49.00 84.70 4.90 49.50
94.00 97.60 48.00 84.46 4.80 49.00
93.00 97.20 47.00 84.21 4.70 48.50
92.00 96.80 46.00 83.90 4.60 48.00
91.00 96.40 45.00 83.60 4.50 47.50
90.00 96.00 44.00 83.30 4.40 47.00
89.00 95.60 43.00 83.00 4.30 46.50
88.00 95.20 42.00 82.80 4.20 46.00
87.00 94.80 41.00 82.53 4.10 45.50
86.00 94.40 40.00 82.20 4.00 45.00
85.00 94.00 39.00 81.87 3.90 44.50
84.00 93.60 38.00 81.54 3.80 44.00
83.00 93.20 37.00 81.21 3.70 43.50
82.00 92.80 36.00 80.88 3.60 43.00
81.00 92.40 35.00 80.55 3.50 42.50
80.00 92.00 34.00 80.22 3.40 42.00
79.00 91.60 33.00 80.00 3.30 41.50
78.00 91.20 32.00 79.37 3.20 41.00
77.00 90.80 31.00 78.75 3.10 40.50
76.00 90.40 30.00 78.12 3.00 40.00
75.00 90.00 29.00 77.50 2.90 39.75
74.00 89.80 28.00 76.87 2.80 39.50
73.00 89.60 27.00 76.25 2.70 39.25
72.00 89.40 26.00 75.62 2.60 39.00
71.00 89.20 25.00 75.00 2.50 38.75
70.00 89.00 24.00 74.00 2.40 38.50
69.00 88.80 23.00 73.00 2.30 38.25
68.00 88.60 22.00 72.00 2.20 38.00
67.00 88.40 21.00 71.00 2.10 37.75
66.00 88.20 20.00 70.00 2.00 37.50
65.00 88.00 19.00 69.00 1.90 37.00
64.00 87.80 18.00 68.00 1.80 36.50
63.00 87.60 17.00 67.00 1.70 36.00
62.00 87.40 16.00 66.00 1.60 35.50
61.00 87.20 15.00 65.00 1.50 35.00
60.00 87.00 14.00 64.00 1.40 34.50
59.00 86.80 13.00 63.00 1.30 34.00
58.00 86.60 12.00 62.00 1.20 33.50
57.00 86.40 11.00 61.00 1.10 33.00
56.00 86.20 10.00 60.00 1.00 32.50
55.00 86.00 9.00 58.00
Lampiran 2/ Attachment 2
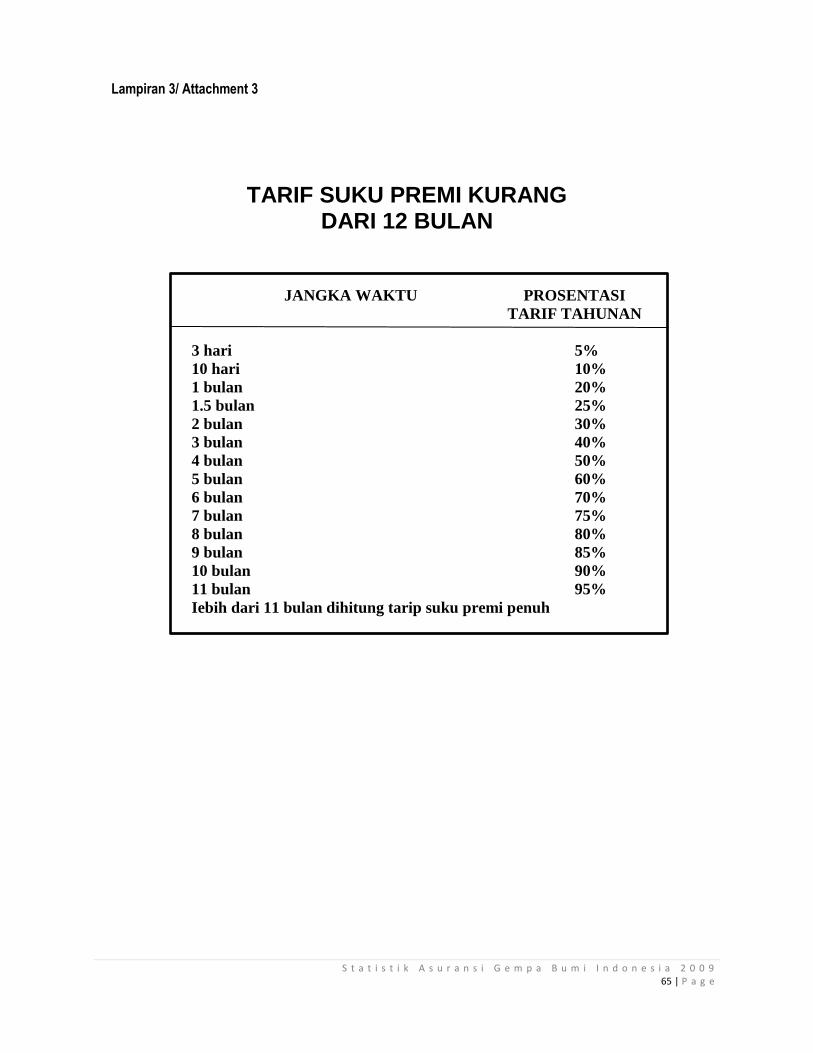
S t a t i s t i k A s u r a n s i G e m p a B u m i I n d o n e s i a 2 0 0 9 65 | P a g e
TARIF SUKU PREMI KURANG DARI 12 BULAN
JANGKA WAKTU PROSENTASI
TARIF TAHUNAN
3 hari 5%
10 hari 10%
1 bulan 20%
1.5 bulan 25%
2 bulan 30%
3 bulan 40%
4 bulan 50%
5 bulan 60%
6 bulan 70%
7 bulan 75%
8 bulan 80%
9 bulan 85%
10 bulan 90%
11 bulan 95%
Iebih dari 11 bulan dihitung tarip suku premi penuh
Lampiran 3/ Attachment 3

S t a t i s t i k A s u r a n s i G e m p a B u m i I n d o n e s i a 2 0 0 9 66 | P a g e
Related Documents