PENGUMUMAN Equity Research PT KMI Wire and Cable Tbk (KBLI) (Tercatat di Papan: Pengembangan) No.: Peng-ER-00016/BEI.PPR/08-2012 (dapat dilihat di internet : http://www.idx.co.id ) PT Bursa Efek Indonesia pada tanggal 14 Agustus 2012 telah menerima surat dari PT Pemeringkat Efek Indonesia dengan No.: 1352/PEF-DIR/VIII/2012 tanggal 10 Agustus 2012, perihal publikasi laporan penilaian target harga referensi saham PT KMI Wire and Cable Tbk sebagaimana terlampir. (lampiran 31 lembar) Demikian pemberitahuan yang disampaikan PT Pemeringkat Efek Indonesia 14 Agustus 2012 I Gede Nyoman Yetna Andre PJ. Toelle Kepala Divisi Penilaian Perusahaan Sektor Riil Kepala Divisi Perdagangan Saham Tembusan: 1. Yth. Ketua Bapepam dan LK; 2. Yth. Kepala Biro TLE Bapepam dan LK; 3. Yth. Kepala Biro PKP Sektor Riil Bapepam dan LK; 4. Yth. Pusat Referensi Pasar Modal; 5. Yth. Direktur Indonesian Capital Market Electronic Library; 6. Yth. Direksi PT KMI Wire and Cable Tbk. RAR_KBLI_er_20120814_00016

Welcome message from author
This document is posted to help you gain knowledge. Please leave a comment to let me know what you think about it! Share it to your friends and learn new things together.
Transcript
PENGUMUMAN Equity Research
PT KMI Wire and Cable Tbk (KBLI) (Tercatat di Papan: Pengembangan)
No.: Peng-ER-00016/BEI.PPR/08-2012 (dapat dilihat di internet : http://www.idx.co.id)
PT Bursa Efek Indonesia pada tanggal 14 Agustus 2012 telah menerima surat dari PT Pemeringkat Efek Indonesia dengan No.: 1352/PEF-DIR/VIII/2012 tanggal 10 Agustus 2012, perihal publikasi laporan penilaian target harga referensi saham PT KMI Wire and Cable Tbk sebagaimana terlampir. (lampiran 31 lembar) Demikian pemberitahuan yang disampaikan PT Pemeringkat Efek Indonesia
14 Agustus 2012
I Gede Nyoman Yetna Andre PJ. Toelle Kepala Divisi Penilaian Perusahaan Sektor Riil Kepala Divisi Perdagangan Saham Tembusan:
1. Yth. Ketua Bapepam dan LK; 2. Yth. Kepala Biro TLE Bapepam dan LK; 3. Yth. Kepala Biro PKP Sektor Riil Bapepam dan LK; 4. Yth. Pusat Referensi Pasar Modal; 5. Yth. Direktur Indonesian Capital Market Electronic Library; 6. Yth. Direksi PT KMI Wire and Cable Tbk.
RAR_KBLI_er_20120814_00016

PEFINDO CREDIT RATING INDONESIA1352/PEF-DIR/VIII/2012
Jakarta, 10 Agustus 2012
Kepada Yth.1. PT KMI Wire and Cable, Tbk
JI. Raya Bekasi Km. 23, 1-CakungJakarta Timur, 13910
u.p. Bapak Asep Kusno, Corporate Secretary
2. PT Bursa Efek IndonesiaGedung Bursa Efek IndonesiaJI. Jend. Sudirman Kav 52-53Jakarta Selatan, 12190
u.p. Bapak !to Warsito, Direktur UtamaBapak Hoesen, Direktur Penilaian Perusahaan
Perihal: Publikasi Laporan Penilaian Target Harga Referensi Saham PT KMI Wire andCable Tbk.
Dengan hormat,
Sehubungan dengan penugasan yang kami peroleh untuk melakukan Penilaian Target HargaReferensi Saham, dengan ini kami sampaikan hasil penilaian kami atas saham PT KMI Wire and CableTbk (KBLI) dalam versi Bahasa Indonesia dan Bahasa Inggris.
Apabila masih ada hal-hal yang memerlukan penjelasan lebih lanjut, mohon agar menghubungi kami.Atas perhatian dan kerjasamanya, kami ucapkan terima kasih.
Hormat kami,
Ronald T. Andi Kasim, CFADirektur Utama
e Rizalirektur
Tembusan : Bapak I Gede Nyoman Yetna, Kepala Divisi Pencatatan Sektor Riil, PT Bursa EfekIndonesia
Ima
PT. Pemeringkat Efek IndonesiaPanin Tower Senayan City, 17th FloorJI. Asia Afrika Lot. 19, Jakarta 10270, INDONESIAPhone: (62-21) 7278 2380 • Fax: (62-21) 7278 2370

Halaman 1 dari 15
Kontak:
Equity & Index Valuation Division Phone: (6221) 7278 2380 [email protected] “Pernyataan disclaimer pada halaman akhir
merupakan bagian yang tidak terpisahkan dari
dokumen ini”
www.pefindo.com
KMI Wire and Cable, Tbk Laporan Kedua
Equity Valuation
9 Agustus 2012
Target Harga
Terendah Tertinggi 260 305
Kabel
Kinerja Saham
0
50
100
150
200
250
0
500
1,000
1,500
2,000
2,500
3,000
3,500
4,000
4,500
Aug-11 Oct-11 Dec-11 Feb-12 Apr-12 Jun-12
KBLIJCI
JCI KBLI Sumber: Bloomberg
Informasi Saham Rp
Kode Saham KBLI
Harga Saham Per 8 Agustus 2012 194
Harga Tertinggi 52 minggu terakhir 197
Harga Terendah 52 minggu terakhir 80
Kapitalisasi Pasar Tertinggi 52 minggu (miliar) 789
Kapitalisasi Pasar Terendah 52 minggu (miliar) 321
Penilaian Saham Sebelumnya Saat ini
Tertinggi 255 305
Terendah 225 260
Market Value Added & Market Risk
0
0.2
0.4
0.6
0.8
1
1.2
-80
-70
-60
-50
-40
-30
-20
-10
0
10
20
1Q11 1Q12
Mar
ket
Ris
k
MV
A
MVA Market Risk
Sumber:Bloomberg, Pefindo Divisi Valuasi Saham & Indexing
Pemegang Saham
(%)
Javas Premier Venture Capital Limited 47,68
BNP Paribas Private Singapore c/o Hongkong and Shanghai Bank 8,69
GS LND Clear AC c/o Citibank, N.A 7,80
GSAF Risk Arbritage Investment 7,55
Publik (masing-masing dibawah 5%
kepemilikan) 28,28
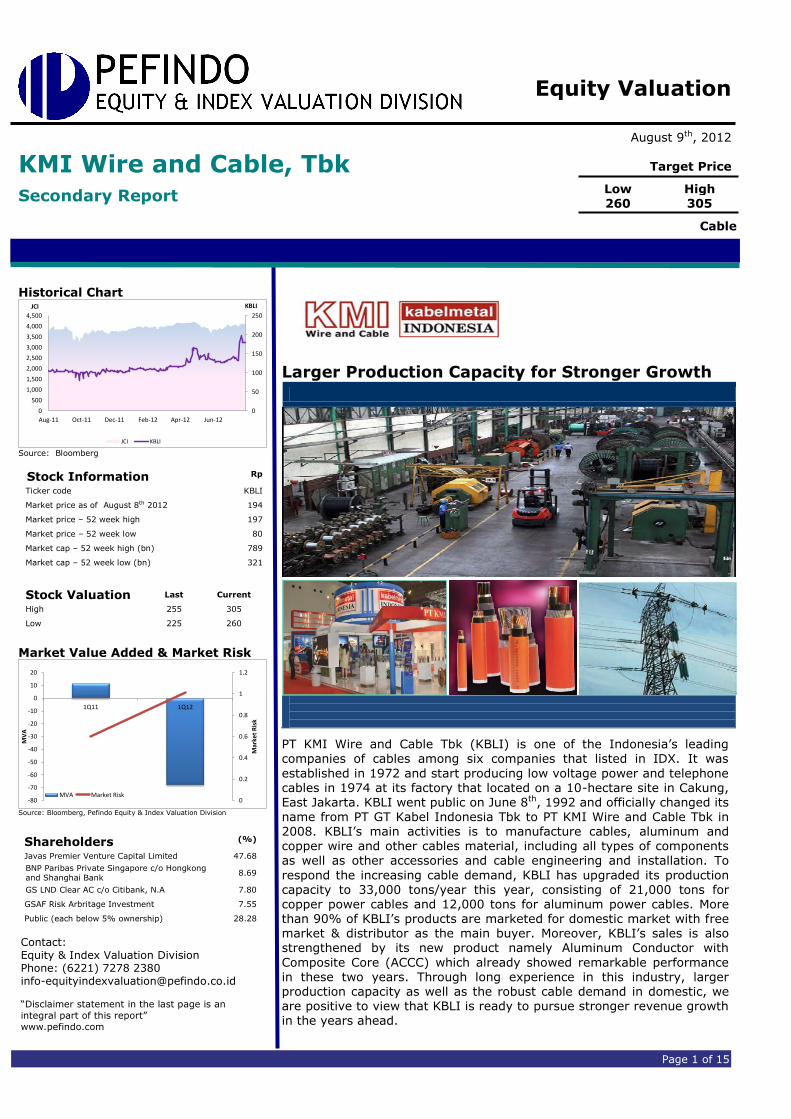
Kapasitas Produksi yang Lebih Besar untuk
Pertumbuhan yang Lebih Kuat
PT KMI Wire and Kabel Tbk (KBLI) adalah salah satu perusahaan kabel terkemuka di Indonesia diantara enam perusahaan yang terdaftar di BEI. KBLI didirikan pada 1972 dan mulai memproduksi kabel tegangan rendah dan kabel telepon pada tahun 1974 di pabriknya yang terletak di atas lahan seluas 10 hektar di Cakung, Jakarta Timur. KBLI go public pada
8 Juni 1992 dan resmi berganti nama dari PT GT Kabel Indonesia Tbk menjadi PT KMI Wire and Cable Tbk pada 2008. Kegiatan utama KBLI adalah terutama untuk memproduksi kabel, kawat aluminium dan
tembaga serta bahan kabel, termasuk semua jenis komponen serta aksesoris lainnya dan kabel instalasi. Untuk merespon permintaan kabel yang meningkat, KBLI telah meningkatkan kapasitas produksinya menjadi 33.000 ton/tahun pada tahun ini, yang terdiri dari 21.000 ton
untuk kabel listrik tembaga dan 12.000 ton kabel listrik aluminium. Lebih dari 90% produk KBLI dipasarkan untuk pasar domestik dengan pasar umum dan distributor sebagai pembeli utama. Selain itu, penjualan KBLI juga diperkuat oleh produk barunya yaitu Aluminum Conductor with Composite Core (ACCC) yang telah menunjukkan kinerja yang luar biasa dalam dua tahun terakhir. Dengan pengalaman panjang dalam industri
ini, kapasitas produksi yang lebih besar serta permintaan kabel yang kuat di dalam negeri, kami percaya bahwa KBLI siap untuk mengejar pertumbuhan pendapatan yang kuat di tahun-tahun mendatang.

“Pernyataan disclaimer pada halaman
akhir merupakan bagian tak
terpisahkan dari dokumen ini”
www.pefindo.com
KMI Wire and Cable, Tbk
9 Agustus 2012 Halaman 2 dari 15
Penyesuaian Target Harga Saham Kami melakukan beberapa penyesuaian terhadap proyeksi kami sebelumnya dan menyesuaikan target harga saham KBLI menjadi pada kisaran Rp 260 – Rp 305 per saham, berdasarkan pertimbangan-pertimbangan berikut:
Fundamental ekonomi Indonesia relatif kuat terhadap resesi ekonomi global. Hal ini terutama karena permintaan domestik yang kuat, yang terus menjadi tulang punggung perekonomian. Kondisi tersebut tentu akan memberikan dampak positif bagi industri properti, yang merupakan pendorong utama usaha KBLI. Selain itu, proyek pemerintah, melalui PLN, juga menunjukkan penjualan yang
menggembirakan bagi KBLI dengan mencapai Rp 56 miliar, atau tumbuh sebesar 136% YoY di 1Q12. Oleh karena itu, kami percaya bahwa KBLI bisa mencatat pertumbuhan memuaskan di tahun-tahun mendatang.
Selama 2011, KBLI mencatat kinerja mengesankan dengan pertumbuhan pendapatan 50% YoY atau mencapai Rp 1.842 miliar, di atas proyeksi kami sebelumnya yaitu Rp 1.763 miliar. Hal ini terutama
disebabkan oleh meningkatnya volume penjualan dan harga jual. Selanjutnya di 1Q12, kinerja KBLI tetap luar biasa dengan membukukan pertumbuhan penjualan sebesar 67% YoY menjadi Rp 504 miliar. Peningkatan ini bahkan lebih tinggi dari rata-rata industri yang hanya 39% YoY pada periode tersebut. Selain kemampuannya dalam memperkuat pertumbuhan pendapatan, KBLI juga mampu
melakukan efisiensi, yang selanjutnya menggiring marjin profitabilitasnya menjadi lebih baik. Marjin laba kotor dan laba usaha meningkat menjadi 10,5% dan 7,4% dibandingkan 9,8% dan 5,5% di 1Q11.
Neraca KBLI terlihat lebih sehat dengan memperhatikan rasio hutang terhadap ekuitas (DER) yang lebih rendah yaitu 0.54x, dibandingkan 1.01x di 1Q11. Hal itu karena peningkatan ekuitas KBLI sebagai hasil
dari kuasi-reorganisasi di 2011.
Asumsi risk free rate, equity premium dan beta masing-masing adalah sebesar 5,7%, 7,1% dan 0,8x.
Mesin-mesin Baru untuk Mendorong Kapasitas Produksi Untuk mengantisipasi meningkatnya permintaan kabel, KBLI telah memutuskan strategi yang tepat dengan cara menambahkan mesin baru
untuk menggenjot kapasitas produksinya. Atas investasi tersebut, KBLI telah menghabiskan sekitar Rp 30 miliar dan diharapkan dapat meningkatkan kapasitas produksi KBLI sebesar 22% YoY menjadi 33.000 ton/tahun dari 27.000 ton/tahun pada 2011. Dengan kapasitas produksi yang lebih tinggi, kami percaya volume penjualan KBLI dapat melonjak sebesar 19% YoY di 2012, melihat pertumbuhan yang kuat dari sektor
properti dan Teknologi Informasi (TI) yang dapat meningkatkan kebutuhan kabel dan perangkat koneksinya.
Menjual Sebagian Besar Produknya ke dalam Negeri Menguntungkan KBLI Dalam menjalankan aktivitas penjualannya, KBLI memiliki dua segmen pasar berdasarkan wilayah geografis yaitu lokal dan ekspor. Sebagian
besar pendapatan KBLI berasal dari penjualan lokal. Selama periode 2009 – 2011, pendapatan dari pasar lokal tumbuh sebesar CAGR 59%. Kemudian di 1Q12, kontribusi dari pasar lokal sekitar 97% dari total pendapatan sebesar Rp 504 miliar di 1Q12. Kami optimis dalam melihat prospek KBLI di tahun-tahun mendatang, mengingat permintaan kabel yang kuat di dalam negeri dan pangsa pasarnya yang menempati peringkat ketiga di industri kabel atau sekitar 20,7% (per 31 Maret
2012). Untuk 2012, kami memperkirakan pendapatan KBLI dari penjualan lokal dapat naik sebesar 26% YoY atau setara dengan Rp 2.237 miliar.
PARAMETER INVESTASI
“Pernyataan disclaimer pada halaman
akhir merupakan bagian tak
terpisahkan dari dokumen ini”
www.pefindo.com
KMI Wire and Cable, Tbk
9 Agustus 2012 Halaman 3 dari 15
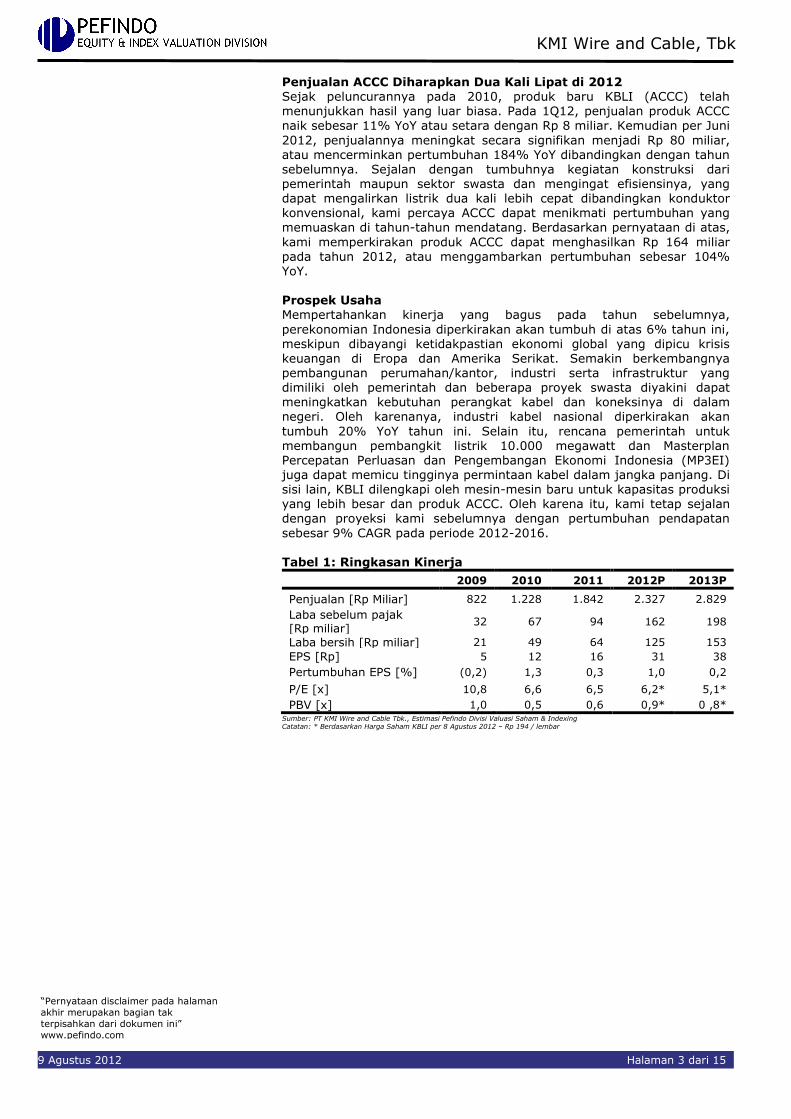
Penjualan ACCC Diharapkan Dua Kali Lipat di 2012 Sejak peluncurannya pada 2010, produk baru KBLI (ACCC) telah menunjukkan hasil yang luar biasa. Pada 1Q12, penjualan produk ACCC
naik sebesar 11% YoY atau setara dengan Rp 8 miliar. Kemudian per Juni
2012, penjualannya meningkat secara signifikan menjadi Rp 80 miliar, atau mencerminkan pertumbuhan 184% YoY dibandingkan dengan tahun sebelumnya. Sejalan dengan tumbuhnya kegiatan konstruksi dari pemerintah maupun sektor swasta dan mengingat efisiensinya, yang dapat mengalirkan listrik dua kali lebih cepat dibandingkan konduktor konvensional, kami percaya ACCC dapat menikmati pertumbuhan yang memuaskan di tahun-tahun mendatang. Berdasarkan pernyataan di atas,
kami memperkirakan produk ACCC dapat menghasilkan Rp 164 miliar pada tahun 2012, atau menggambarkan pertumbuhan sebesar 104% YoY. Prospek Usaha Mempertahankan kinerja yang bagus pada tahun sebelumnya,
perekonomian Indonesia diperkirakan akan tumbuh di atas 6% tahun ini, meskipun dibayangi ketidakpastian ekonomi global yang dipicu krisis
keuangan di Eropa dan Amerika Serikat. Semakin berkembangnya pembangunan perumahan/kantor, industri serta infrastruktur yang dimiliki oleh pemerintah dan beberapa proyek swasta diyakini dapat meningkatkan kebutuhan perangkat kabel dan koneksinya di dalam negeri. Oleh karenanya, industri kabel nasional diperkirakan akan
tumbuh 20% YoY tahun ini. Selain itu, rencana pemerintah untuk membangun pembangkit listrik 10.000 megawatt dan Masterplan Percepatan Perluasan dan Pengembangan Ekonomi Indonesia (MP3EI) juga dapat memicu tingginya permintaan kabel dalam jangka panjang. Di sisi lain, KBLI dilengkapi oleh mesin-mesin baru untuk kapasitas produksi yang lebih besar dan produk ACCC. Oleh karena itu, kami tetap sejalan dengan proyeksi kami sebelumnya dengan pertumbuhan pendapatan
sebesar 9% CAGR pada periode 2012-2016. Tabel 1: Ringkasan Kinerja
2009 2010 2011 2012P 2013P
Penjualan [Rp Miliar] 822 1.228 1.842 2.327 2.829
Laba sebelum pajak [Rp miliar]
32 67 94 162 198
Laba bersih [Rp miliar] 21 49 64 125 153
EPS [Rp] 5 12 16 31 38
Pertumbuhan EPS [%] (0,2) 1,3 0,3 1,0 0,2
P/E [x] 10,8 6,6 6,5 6,2* 5,1*
PBV [x] 1,0 0,5 0,6 0,9* 0 ,8* Sumber: PT KMI Wire and Cable Tbk., Estimasi Pefindo Divisi Valuasi Saham & Indexing Catatan: * Berdasarkan Harga Saham KBLI per 8 Agustus 2012 – Rp 194 / lembar
“Pernyataan disclaimer pada halaman akhir merupakan bagian tak
terpisahkan dari dokumen ini”
www.pefindo.com
Martina Berto, Tbk
2 9 Agustus 2012 Halaman 4 dari 15
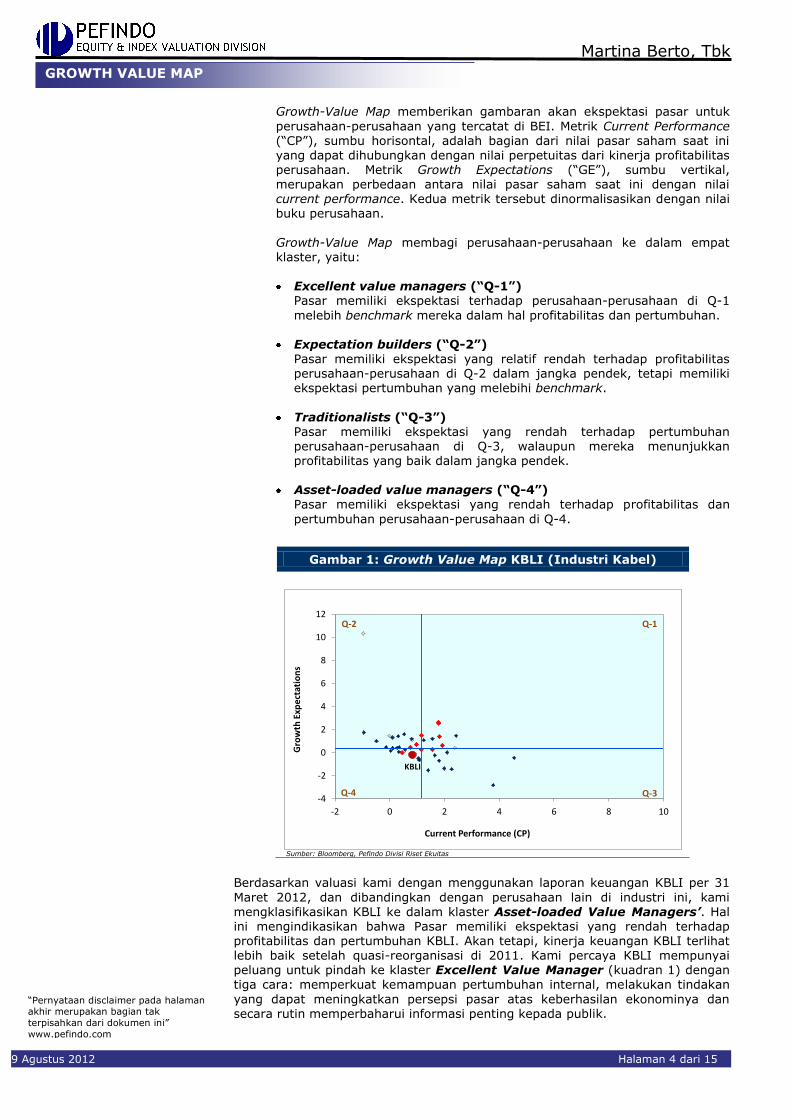
Growth-Value Map memberikan gambaran akan ekspektasi pasar untuk
perusahaan-perusahaan yang tercatat di BEI. Metrik Current Performance (“CP”), sumbu horisontal, adalah bagian dari nilai pasar saham saat ini yang dapat dihubungkan dengan nilai perpetuitas dari kinerja profitabilitas perusahaan. Metrik Growth Expectations (“GE”), sumbu vertikal, merupakan perbedaan antara nilai pasar saham saat ini dengan nilai current performance. Kedua metrik tersebut dinormalisasikan dengan nilai buku perusahaan.
Growth-Value Map membagi perusahaan-perusahaan ke dalam empat klaster, yaitu:
Excellent value managers (“Q-1”)
Pasar memiliki ekspektasi terhadap perusahaan-perusahaan di Q-1
melebih benchmark mereka dalam hal profitabilitas dan pertumbuhan. Expectation builders (“Q-2”)
Pasar memiliki ekspektasi yang relatif rendah terhadap profitabilitas perusahaan-perusahaan di Q-2 dalam jangka pendek, tetapi memiliki ekspektasi pertumbuhan yang melebihi benchmark.
Traditionalists (“Q-3”) Pasar memiliki ekspektasi yang rendah terhadap pertumbuhan perusahaan-perusahaan di Q-3, walaupun mereka menunjukkan profitabilitas yang baik dalam jangka pendek.
Asset-loaded value managers (“Q-4”)
Pasar memiliki ekspektasi yang rendah terhadap profitabilitas dan
pertumbuhan perusahaan-perusahaan di Q-4.
Berdasarkan valuasi kami dengan menggunakan laporan keuangan KBLI per 31
Maret 2012, dan dibandingkan dengan perusahaan lain di industri ini, kami mengklasifikasikan KBLI ke dalam klaster Asset-loaded Value Managers’. Hal ini mengindikasikan bahwa Pasar memiliki ekspektasi yang rendah terhadap profitabilitas dan pertumbuhan KBLI. Akan tetapi, kinerja keuangan KBLI terlihat lebih baik setelah quasi-reorganisasi di 2011. Kami percaya KBLI mempunyai peluang untuk pindah ke klaster Excellent Value Manager (kuadran 1) dengan tiga cara: memperkuat kemampuan pertumbuhan internal, melakukan tindakan
yang dapat meningkatkan persepsi pasar atas keberhasilan ekonominya dan secara rutin memperbaharui informasi penting kepada publik.
Gambar 1: Growth Value Map KBLI (Industri Kabel)
-4
-2
0
2
4
6
8
10
12
-2 0 2 4 6 8 10
Gro
wth
Exp
ecta
tio
ns
Current Performance (CP)
Q-1
Q-3
Q-2
Q-4
KBLI
Sumber: Bloomberg, Pefindo Divisi Riset Ekuitas
GROWTH VALUE MAP
“Pernyataan disclaimer pada halaman
akhir merupakan bagian tak
terpisahkan dari dokumen ini”
www.pefindo.com
KMI Wire and Cable, Tbk
9 Agustus 2012 Halaman 5 dari 15
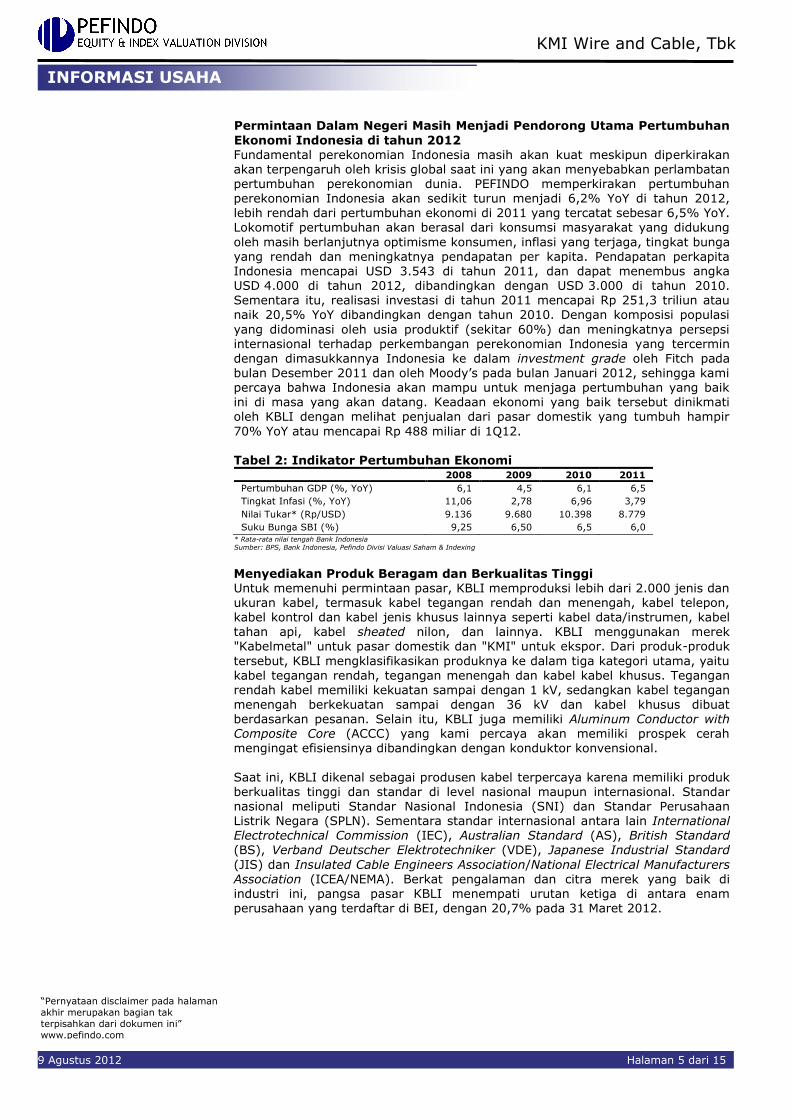
Permintaan Dalam Negeri Masih Menjadi Pendorong Utama Pertumbuhan
Ekonomi Indonesia di tahun 2012 Fundamental perekonomian Indonesia masih akan kuat meskipun diperkirakan akan terpengaruh oleh krisis global saat ini yang akan menyebabkan perlambatan pertumbuhan perekonomian dunia. PEFINDO memperkirakan pertumbuhan perekonomian Indonesia akan sedikit turun menjadi 6,2% YoY di tahun 2012, lebih rendah dari pertumbuhan ekonomi di 2011 yang tercatat sebesar 6,5% YoY. Lokomotif pertumbuhan akan berasal dari konsumsi masyarakat yang didukung
oleh masih berlanjutnya optimisme konsumen, inflasi yang terjaga, tingkat bunga yang rendah dan meningkatnya pendapatan per kapita. Pendapatan perkapita Indonesia mencapai USD 3.543 di tahun 2011, dan dapat menembus angka USD 4.000 di tahun 2012, dibandingkan dengan USD 3.000 di tahun 2010. Sementara itu, realisasi investasi di tahun 2011 mencapai Rp 251,3 triliun atau naik 20,5% YoY dibandingkan dengan tahun 2010. Dengan komposisi populasi
yang didominasi oleh usia produktif (sekitar 60%) dan meningkatnya persepsi internasional terhadap perkembangan perekonomian Indonesia yang tercermin
dengan dimasukkannya Indonesia ke dalam investment grade oleh Fitch pada bulan Desember 2011 dan oleh Moody’s pada bulan Januari 2012, sehingga kami percaya bahwa Indonesia akan mampu untuk menjaga pertumbuhan yang baik ini di masa yang akan datang. Keadaan ekonomi yang baik tersebut dinikmati oleh KBLI dengan melihat penjualan dari pasar domestik yang tumbuh hampir
70% YoY atau mencapai Rp 488 miliar di 1Q12. Tabel 2: Indikator Pertumbuhan Ekonomi
2008 2009 2010 2011
Pertumbuhan GDP (%, YoY)
Tingkat Infasi (%, YoY)
Nilai Tukar* (Rp/USD)
Suku Bunga SBI (%)
6,1
11,06
9.136
9,25
4,5
2,78
9.680
6,50
6,1
6,96
10.398
6,5
6,5
3,79
8.779
6,0 * Rata-rata nilai tengah Bank Indonesia Sumber: BPS, Bank Indonesia, Pefindo Divisi Valuasi Saham & Indexing
Menyediakan Produk Beragam dan Berkualitas Tinggi Untuk memenuhi permintaan pasar, KBLI memproduksi lebih dari 2.000 jenis dan
ukuran kabel, termasuk kabel tegangan rendah dan menengah, kabel telepon, kabel kontrol dan kabel jenis khusus lainnya seperti kabel data/instrumen, kabel tahan api, kabel sheated nilon, dan lainnya. KBLI menggunakan merek "Kabelmetal" untuk pasar domestik dan "KMI" untuk ekspor. Dari produk-produk
tersebut, KBLI mengklasifikasikan produknya ke dalam tiga kategori utama, yaitu kabel tegangan rendah, tegangan menengah dan kabel kabel khusus. Tegangan rendah kabel memiliki kekuatan sampai dengan 1 kV, sedangkan kabel tegangan menengah berkekuatan sampai dengan 36 kV dan kabel khusus dibuat berdasarkan pesanan. Selain itu, KBLI juga memiliki Aluminum Conductor with Composite Core (ACCC) yang kami percaya akan memiliki prospek cerah mengingat efisiensinya dibandingkan dengan konduktor konvensional.
Saat ini, KBLI dikenal sebagai produsen kabel terpercaya karena memiliki produk berkualitas tinggi dan standar di level nasional maupun internasional. Standar nasional meliputi Standar Nasional Indonesia (SNI) dan Standar Perusahaan Listrik Negara (SPLN). Sementara standar internasional antara lain International Electrotechnical Commission (IEC), Australian Standard (AS), British Standard
(BS), Verband Deutscher Elektrotechniker (VDE), Japanese Industrial Standard
(JIS) dan Insulated Cable Engineers Association/National Electrical Manufacturers Association (ICEA/NEMA). Berkat pengalaman dan citra merek yang baik di industri ini, pangsa pasar KBLI menempati urutan ketiga di antara enam perusahaan yang terdaftar di BEI, dengan 20,7% pada 31 Maret 2012.
INFORMASI USAHA

“Pernyataan disclaimer pada halaman
akhir merupakan bagian tak
terpisahkan dari dokumen ini”
www.pefindo.com
KMI Wire and Cable, Tbk
9 Agustus 2012 Halaman 6 dari 15
Gambar 2: Beberapa Produk KBLI
Sumber: PT KMI Wire and Cable Tbk, Pefindo Divisi Valuasi Saham & Indexing
Memiliki Beberapa Pelanggan Mengurangi Risiko Usaha KBLI Dalam menjalankan aktivitas penjualannya, KBLI membagi pelanggan-pelanggannya menjadi tiga segmen, antara lain pasar umum & distributor, PLN dan ekspor. Diantara segmen tersebut, pasar umum & distributor muncul sebagai kontributor utama terhadap total pendapatan KBLI. Pada 1Q12, pasar umum & distributor menghasilkan sekitar Rp 432 miliar, atau mencerminkan kontribusi
sebesar 86%. Kemudian diikuti oleh PLN dan ekspor dengan porsi 11% dan 3% dari Rp 504 miliar. Kami mencatat bahwa proyek pemerintah melalui PLN menunjukkan tren kenaikan, seperti yang ditunjukkan oleh penjualan kepada PLN yang tumbuh sebesar 136% YoY di 1Q12. Kami percaya bahwa pelanggan yang beragam akan meminimalisir risiko bisnis KBLI.
Gambar 3: Penjualan KBLI Berdasarkan Segmen Pasar
432
56
16
dalam Rp miliar
Pasar Umum & Distributor
PLN
Ekspor
Sumber: PT KMI Wire and Cable Tbk, Pefindo Divisi Valuasi Saham & Indexing
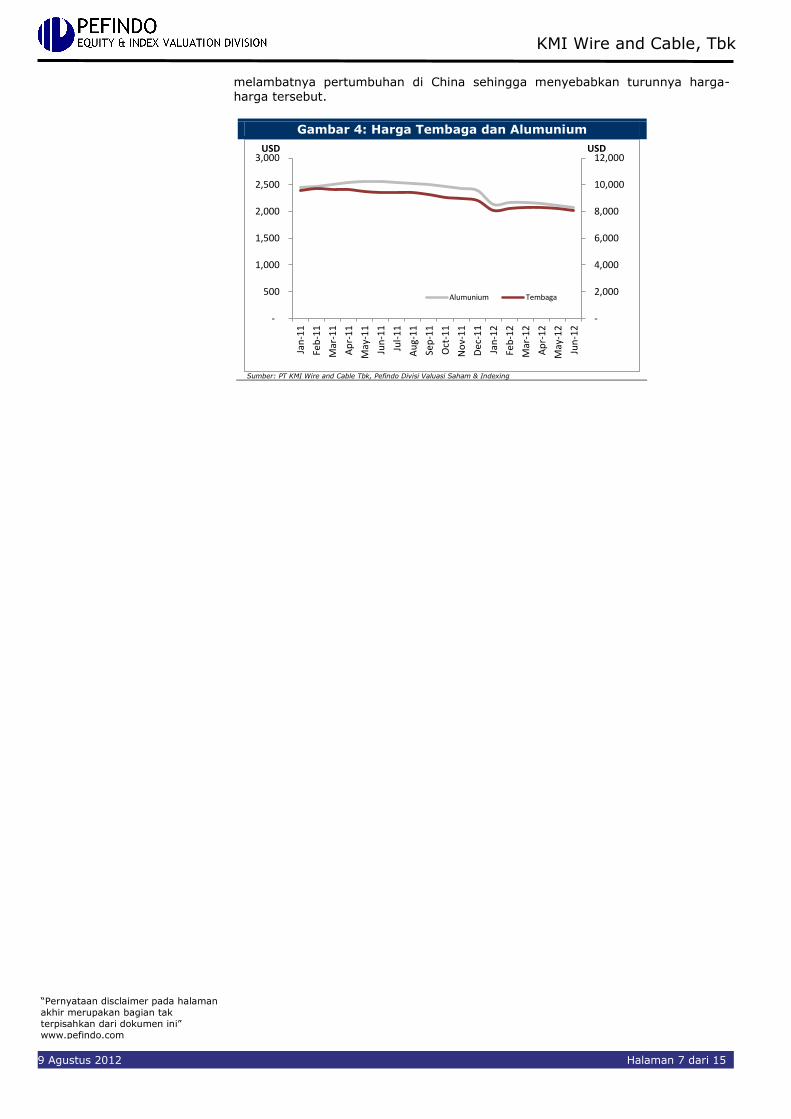
Tren Penurunan Harga Bahan Baku Tembaga dan aluminium, yang merupakan bahan baku utama KBLI dalam memproduksi kabel, mengalami tren penurunan dibandingkan periode tahun lalu.
Kami menggunakan harga referensi London Metal Exchange (LME) karena merupakan bursa berjangka terbesar dunia untuk kontrak logam. Pada 31 Maret 2012, harga rata-rata tembaga sebesar USD 8.308/ton, atau turun 14% YoY dari USD 9.651/ton di 31 Maret 2011. Sementara harga rata-rata alumunium juga mengalami penurunan sebesar 13% YoY menjadi USD 2.175/ton pada 31 Maret 2012. Oleh karenanya, hal tersebut menyebabkan marjin laba kotor KBLI terlihat lebih baik menjadi 10,52% dari 9,75% di 1Q11. Penurunan permintaan untuk
tembaga dan aluminium dikarenakan adanya resesi ekonomi global dan
“Pernyataan disclaimer pada halaman
akhir merupakan bagian tak
terpisahkan dari dokumen ini”
www.pefindo.com
KMI Wire and Cable, Tbk
9 Agustus 2012 Halaman 7 dari 15
melambatnya pertumbuhan di China sehingga menyebabkan turunnya harga-harga tersebut.
Gambar 4: Harga Tembaga dan Alumunium
-
2,000
4,000
6,000
8,000
10,000
12,000
-
500
1,000
1,500
2,000
2,500
3,000
Jan
-11
Feb
-11
Mar
-11
Ap
r-1
1
May
-11
Jun
-11
Jul-
11
Au
g-1
1
Sep
-11
Oct
-11
No
v-1
1
De
c-1
1
Jan
-12
Feb
-12
Mar
-12
Ap
r-1
2
May
-12
Jun
-12
USDUSD
Alumunium Tembaga
Sumber: PT KMI Wire and Cable Tbk, Pefindo Divisi Valuasi Saham & Indexing
“Pernyataan disclaimer pada halaman
akhir merupakan bagian tak
terpisahkan dari dokumen ini”
www.pefindo.com
KMI Wire and Cable, Tbk
9 Agustus 2012 Halaman 8 dari 15
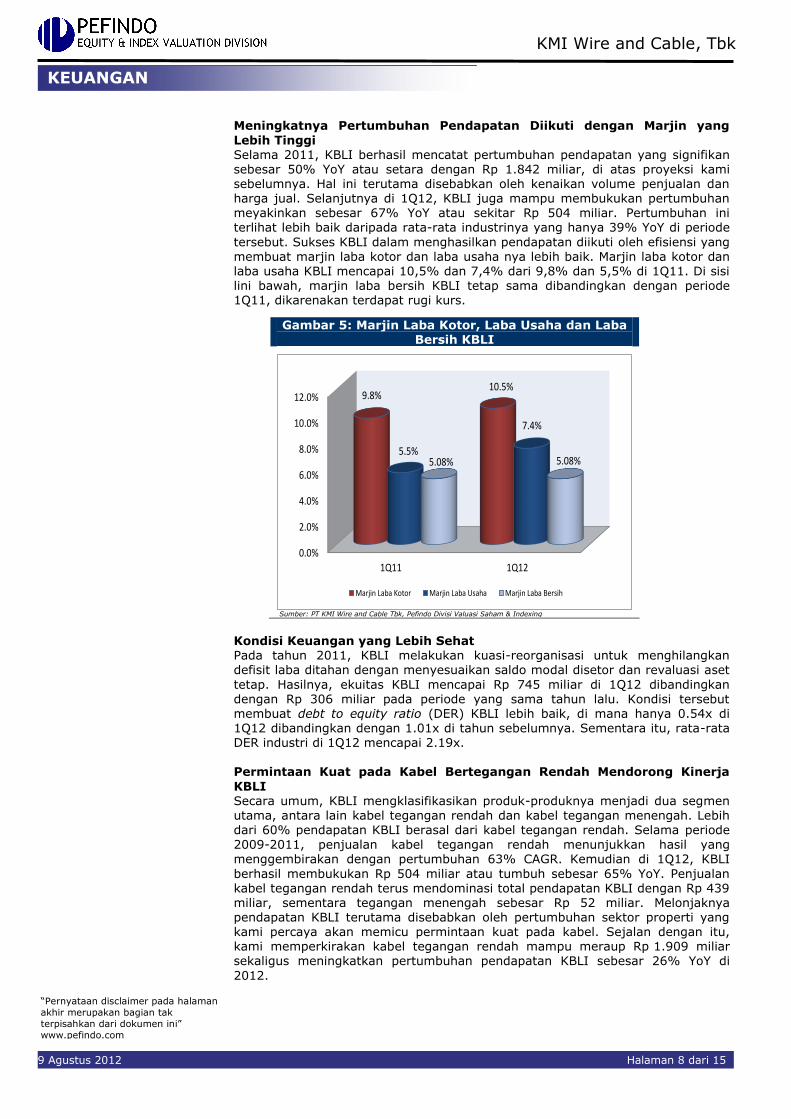
Meningkatnya Pertumbuhan Pendapatan Diikuti dengan Marjin yang
Lebih Tinggi Selama 2011, KBLI berhasil mencatat pertumbuhan pendapatan yang signifikan sebesar 50% YoY atau setara dengan Rp 1.842 miliar, di atas proyeksi kami sebelumnya. Hal ini terutama disebabkan oleh kenaikan volume penjualan dan harga jual. Selanjutnya di 1Q12, KBLI juga mampu membukukan pertumbuhan meyakinkan sebesar 67% YoY atau sekitar Rp 504 miliar. Pertumbuhan ini terlihat lebih baik daripada rata-rata industrinya yang hanya 39% YoY di periode
tersebut. Sukses KBLI dalam menghasilkan pendapatan diikuti oleh efisiensi yang membuat marjin laba kotor dan laba usaha nya lebih baik. Marjin laba kotor dan laba usaha KBLI mencapai 10,5% dan 7,4% dari 9,8% dan 5,5% di 1Q11. Di sisi lini bawah, marjin laba bersih KBLI tetap sama dibandingkan dengan periode 1Q11, dikarenakan terdapat rugi kurs.
Gambar 5: Marjin Laba Kotor, Laba Usaha dan Laba Bersih KBLI
0.0%
2.0%
4.0%
6.0%
8.0%
10.0%
12.0%
1Q11 1Q12
9.8%10.5%
5.5%
7.4%
5.08% 5.08%
Marjin Laba Kotor Marjin Laba Usaha Marjin Laba Bersih
Sumber: PT KMI Wire and Cable Tbk, Pefindo Divisi Valuasi Saham & Indexing
Kondisi Keuangan yang Lebih Sehat Pada tahun 2011, KBLI melakukan kuasi-reorganisasi untuk menghilangkan defisit laba ditahan dengan menyesuaikan saldo modal disetor dan revaluasi aset
tetap. Hasilnya, ekuitas KBLI mencapai Rp 745 miliar di 1Q12 dibandingkan dengan Rp 306 miliar pada periode yang sama tahun lalu. Kondisi tersebut membuat debt to equity ratio (DER) KBLI lebih baik, di mana hanya 0.54x di 1Q12 dibandingkan dengan 1.01x di tahun sebelumnya. Sementara itu, rata-rata DER industri di 1Q12 mencapai 2.19x. Permintaan Kuat pada Kabel Bertegangan Rendah Mendorong Kinerja
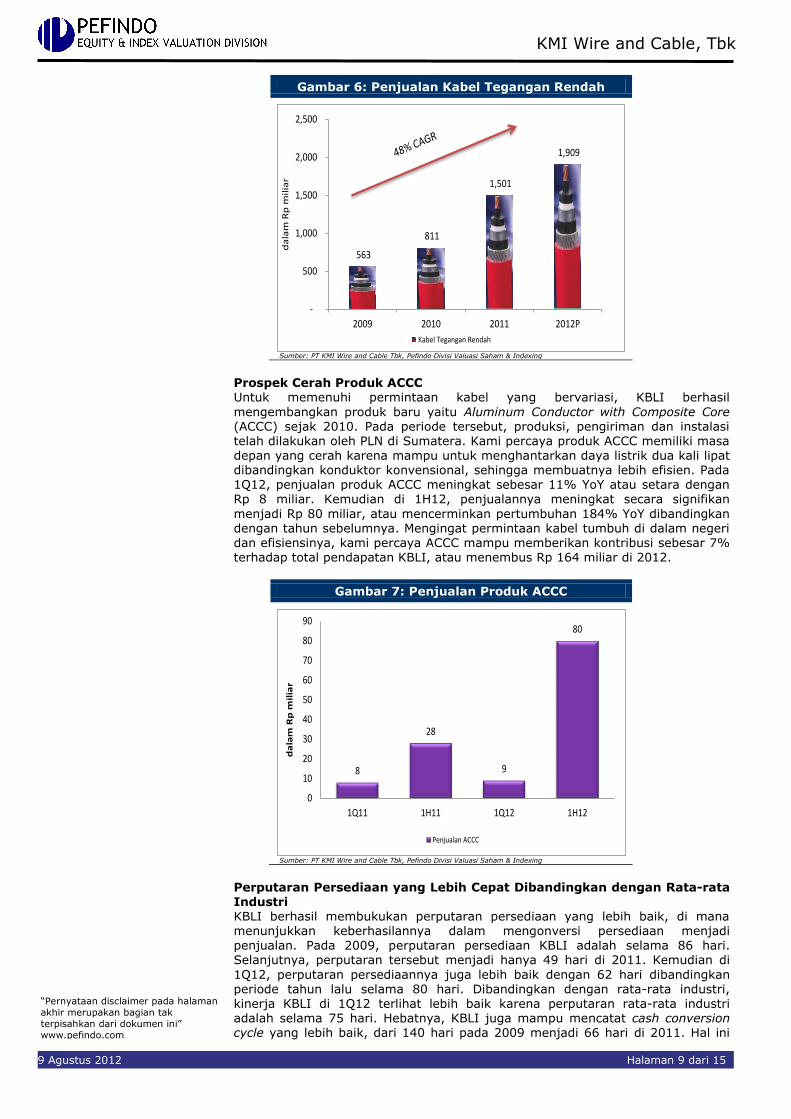
KBLI Secara umum, KBLI mengklasifikasikan produk-produknya menjadi dua segmen utama, antara lain kabel tegangan rendah dan kabel tegangan menengah. Lebih dari 60% pendapatan KBLI berasal dari kabel tegangan rendah. Selama periode
2009-2011, penjualan kabel tegangan rendah menunjukkan hasil yang menggembirakan dengan pertumbuhan 63% CAGR. Kemudian di 1Q12, KBLI
berhasil membukukan Rp 504 miliar atau tumbuh sebesar 65% YoY. Penjualan kabel tegangan rendah terus mendominasi total pendapatan KBLI dengan Rp 439 miliar, sementara tegangan menengah sebesar Rp 52 miliar. Melonjaknya pendapatan KBLI terutama disebabkan oleh pertumbuhan sektor properti yang kami percaya akan memicu permintaan kuat pada kabel. Sejalan dengan itu, kami memperkirakan kabel tegangan rendah mampu meraup Rp 1.909 miliar sekaligus meningkatkan pertumbuhan pendapatan KBLI sebesar 26% YoY di
2012.
KEUANGAN
“Pernyataan disclaimer pada halaman
akhir merupakan bagian tak
terpisahkan dari dokumen ini”
www.pefindo.com
KMI Wire and Cable, Tbk
9 Agustus 2012 Halaman 9 dari 15
Gambar 6: Penjualan Kabel Tegangan Rendah
563
811
1,501
1,909
-
500
1,000
1,500
2,000
2,500
2009 2010 2011 2012P
da
lam
Rp
mil
iar
Kabel Tegangan Rendah
Sumber: PT KMI Wire and Cable Tbk, Pefindo Divisi Valuasi Saham & Indexing
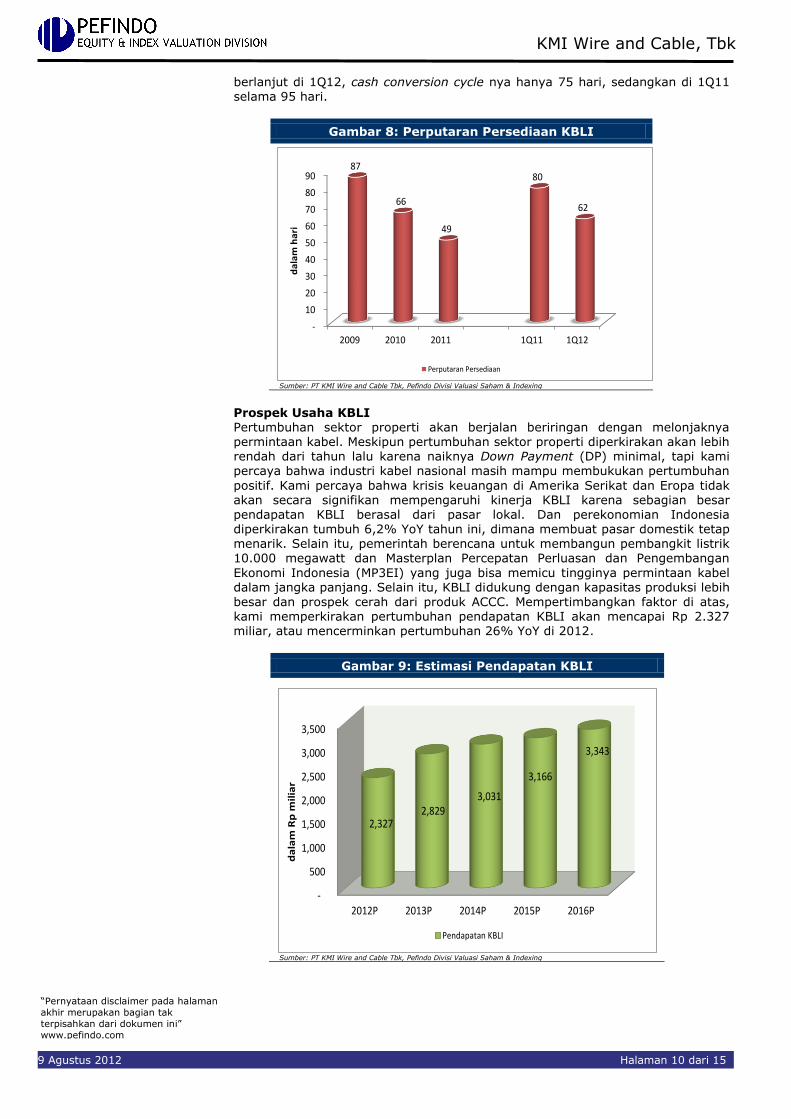
Prospek Cerah Produk ACCC Untuk memenuhi permintaan kabel yang bervariasi, KBLI berhasil
mengembangkan produk baru yaitu Aluminum Conductor with Composite Core (ACCC) sejak 2010. Pada periode tersebut, produksi, pengiriman dan instalasi telah dilakukan oleh PLN di Sumatera. Kami percaya produk ACCC memiliki masa depan yang cerah karena mampu untuk menghantarkan daya listrik dua kali lipat dibandingkan konduktor konvensional, sehingga membuatnya lebih efisien. Pada 1Q12, penjualan produk ACCC meningkat sebesar 11% YoY atau setara dengan Rp 8 miliar. Kemudian di 1H12, penjualannya meningkat secara signifikan
menjadi Rp 80 miliar, atau mencerminkan pertumbuhan 184% YoY dibandingkan dengan tahun sebelumnya. Mengingat permintaan kabel tumbuh di dalam negeri dan efisiensinya, kami percaya ACCC mampu memberikan kontribusi sebesar 7% terhadap total pendapatan KBLI, atau menembus Rp 164 miliar di 2012.
Gambar 7: Penjualan Produk ACCC
8
28
9
80
0
10
20
30
40
50
60
70
80
90
1Q11 1H11 1Q12 1H12
da
lam
Rp
mil
iar
Penjualan ACCC
Sumber: PT KMI Wire and Cable Tbk, Pefindo Divisi Valuasi Saham & Indexing
Perputaran Persediaan yang Lebih Cepat Dibandingkan dengan Rata-rata Industri KBLI berhasil membukukan perputaran persediaan yang lebih baik, di mana menunjukkan keberhasilannya dalam mengonversi persediaan menjadi penjualan. Pada 2009, perputaran persediaan KBLI adalah selama 86 hari. Selanjutnya, perputaran tersebut menjadi hanya 49 hari di 2011. Kemudian di
1Q12, perputaran persediaannya juga lebih baik dengan 62 hari dibandingkan periode tahun lalu selama 80 hari. Dibandingkan dengan rata-rata industri, kinerja KBLI di 1Q12 terlihat lebih baik karena perputaran rata-rata industri adalah selama 75 hari. Hebatnya, KBLI juga mampu mencatat cash conversion cycle yang lebih baik, dari 140 hari pada 2009 menjadi 66 hari di 2011. Hal ini
“Pernyataan disclaimer pada halaman
akhir merupakan bagian tak
terpisahkan dari dokumen ini”
www.pefindo.com
KMI Wire and Cable, Tbk
9 Agustus 2012 Halaman 10 dari 15
berlanjut di 1Q12, cash conversion cycle nya hanya 75 hari, sedangkan di 1Q11 selama 95 hari.
Gambar 8: Perputaran Persediaan KBLI
-
10
20
30
40
50
60
70
80
90
2009 2010 2011 1Q11 1Q12
87
66
49
80
62
da
lam
ha
ri
Perputaran Persediaan
Sumber: PT KMI Wire and Cable Tbk, Pefindo Divisi Valuasi Saham & Indexing
Prospek Usaha KBLI Pertumbuhan sektor properti akan berjalan beriringan dengan melonjaknya permintaan kabel. Meskipun pertumbuhan sektor properti diperkirakan akan lebih rendah dari tahun lalu karena naiknya Down Payment (DP) minimal, tapi kami percaya bahwa industri kabel nasional masih mampu membukukan pertumbuhan
positif. Kami percaya bahwa krisis keuangan di Amerika Serikat dan Eropa tidak akan secara signifikan mempengaruhi kinerja KBLI karena sebagian besar pendapatan KBLI berasal dari pasar lokal. Dan perekonomian Indonesia diperkirakan tumbuh 6,2% YoY tahun ini, dimana membuat pasar domestik tetap menarik. Selain itu, pemerintah berencana untuk membangun pembangkit listrik 10.000 megawatt dan Masterplan Percepatan Perluasan dan Pengembangan
Ekonomi Indonesia (MP3EI) yang juga bisa memicu tingginya permintaan kabel dalam jangka panjang. Selain itu, KBLI didukung dengan kapasitas produksi lebih
besar dan prospek cerah dari produk ACCC. Mempertimbangkan faktor di atas, kami memperkirakan pertumbuhan pendapatan KBLI akan mencapai Rp 2.327 miliar, atau mencerminkan pertumbuhan 26% YoY di 2012.
Gambar 9: Estimasi Pendapatan KBLI
-
500
1,000
1,500
2,000
2,500
3,000
3,500
2012P 2013P 2014P 2015P 2016P
2,327 2,829
3,031
3,166
3,343
da
lam
Rp
mil
iar
Pendapatan KBLI
Sumber: PT KMI Wire and Cable Tbk, Pefindo Divisi Valuasi Saham & Indexing
“Pernyataan disclaimer pada halaman
akhir merupakan bagian tak
terpisahkan dari dokumen ini”
www.pefindo.com
KMI Wire and Cable, Tbk
9 Agustus 2012 Halaman 11 dari 15
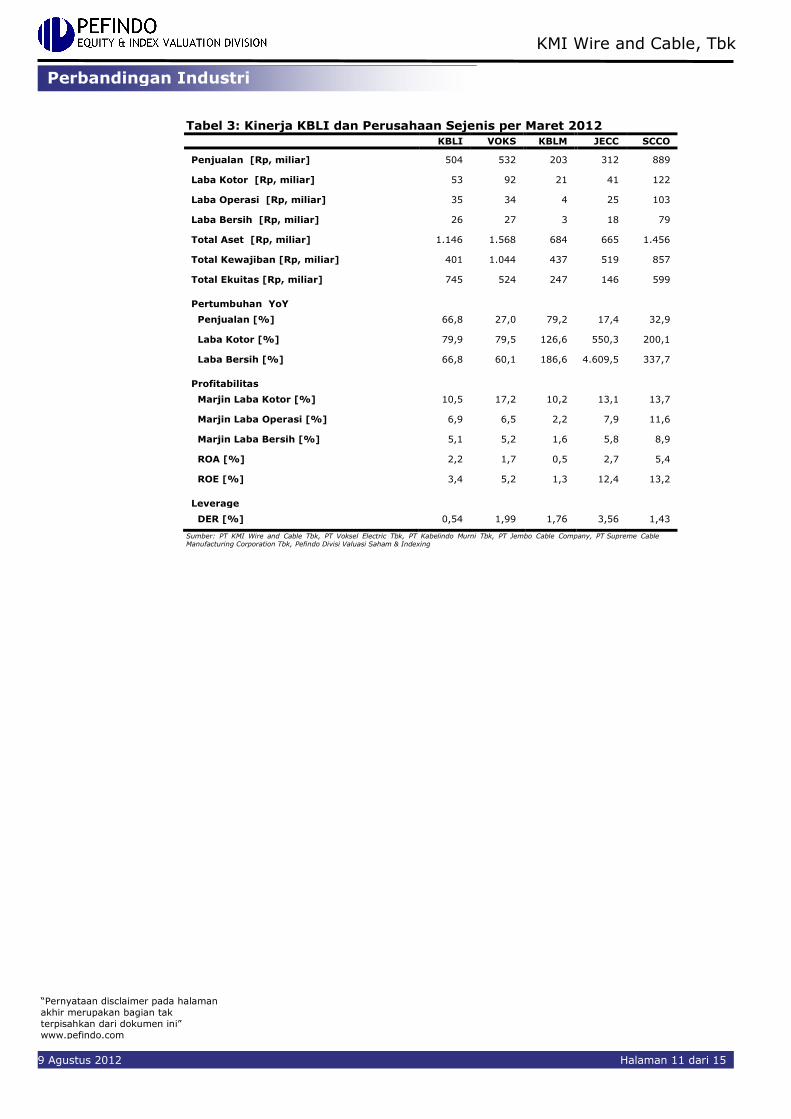
Tabel 3: Kinerja KBLI dan Perusahaan Sejenis per Maret 2012
KBLI VOKS KBLM JECC SCCO
Penjualan [Rp, miliar] 504 532 203 312 889
Laba Kotor [Rp, miliar] 53 92 21 41 122
Laba Operasi [Rp, miliar] 35 34 4 25 103
Laba Bersih [Rp, miliar] 26 27 3 18 79
Total Aset [Rp, miliar] 1.146 1.568 684 665 1.456
Total Kewajiban [Rp, miliar] 401 1.044 437 519 857
Total Ekuitas [Rp, miliar] 745 524 247 146 599
Pertumbuhan YoY
Penjualan [%] 66,8 27,0 79,2 17,4 32,9
Laba Kotor [%] 79,9 79,5 126,6 550,3 200,1
Laba Bersih [%] 66,8 60,1 186,6 4.609,5 337,7
Profitabilitas
Marjin Laba Kotor [%] 10,5 17,2 10,2 13,1 13,7
Marjin Laba Operasi [%] 6,9 6,5 2,2 7,9 11,6
Marjin Laba Bersih [%] 5,1 5,2 1,6 5,8 8,9
ROA [%] 2,2 1,7 0,5 2,7 5,4
ROE [%] 3,4 5,2 1,3 12,4 13,2
Leverage
DER [%] 0,54 1,99 1,76 3,56 1,43
Sumber: PT KMI Wire and Cable Tbk, PT Voksel Electric Tbk, PT Kabelindo Murni Tbk, PT Jembo Cable Company, PT Supreme Cable Manufacturing Corporation Tbk, Pefindo Divisi Valuasi Saham & Indexing
Perbandingan Industri
“Pernyataan disclaimer pada halaman
akhir merupakan bagian tak
terpisahkan dari dokumen ini”
www.pefindo.com
KMI Wire and Cable, Tbk
9 Agustus 2012 Halaman 12 dari 15
VALUASI
Metodologi
Kami mengaplikasikan metode discounted cash flow (DCF) sebagai metode penilaian utama dengan pertimbangan bahwa pertumbuhan pendapatan adalah merupakan faktor yang sangat mempengaruhi nilai (value driver) bagi KBLI jika dibandingkan dengan pertumbuhan aset.
Selanjutnya, kami juga mengaplikasikan metode Guideline company method
(GCM) sebagai metode pembanding lainnya.
Penilaian ini berdasarkan pada nilai 100% saham KBLI per 8 Agustus 2012, menggunakan laporan keuangan KBLI per 31 Maret 2012 sebagai dasar dilakukannya analisa fundamental.
Estimasi Nilai
Kami menggunakan Cost of Capital sebesar 10,9% dan Cost of Equity sebesar 11,2% berdasarkan asumsi-asumsi berikut:
Tabel 4: Asumsi
Risk free rate [%]* 5,7
Risk premium [%]* 7,1
Beta [x]* 0,8
Cost of Equity [%] 11,2
Marginal tax rate [%] 25,0
Debt to Equity Ratio [x] 0,09
WACC [%] 10,9 Sumber: Bloomberg, Estimasi Pefindo Divisi Valuasi Saham & Indexing *Catatan: Per 8 Agustus 2012
Target harga saham untuk 12 bulan berdasarkan posisi penilaian pada tanggal 8 Agustus 2012 adalah sebagai berikut:
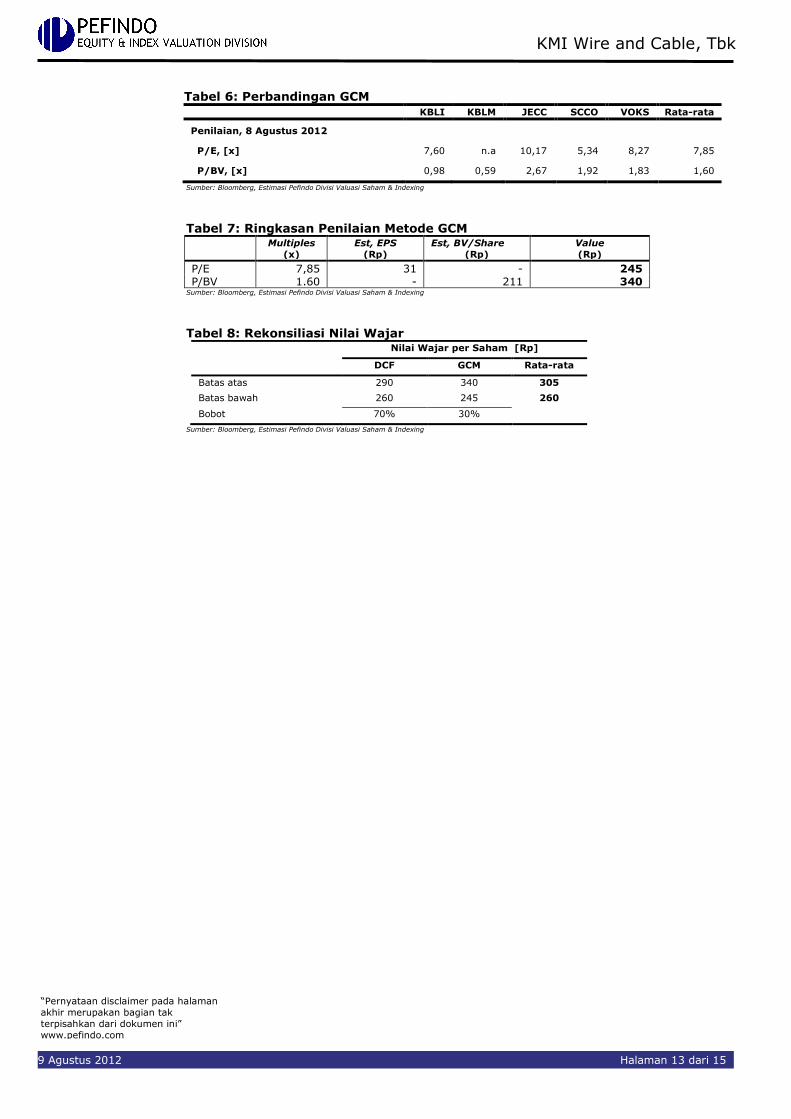
Dengan menggunakan metode DCF dan asumsi tingkat diskonto 10,9% adalah sebesar Rp 260 - Rp 290 per lembar saham.
Dengan metode GCM (PBV 1,60X dan P/E 7,85X) adalah sebesar Rp 245 - Rp 340 per lembar saham.
Untuk mendapatkan nilai yang mewakili kedua indikasi nilai tersebut
dilakukan rekonsiliasi dengan dilakukan pembobotan terhadap kedua metode tersebut sebesar 70% untuk DCF dan 30% untuk metode GCM. Berdasarkan hasil perhitungan di atas, maka Target Harga Saham KBLI untuk 12 bulan adalah Rp 260 - Rp 305 per lembar saham.
Tabel 5: Ringkasan Penilaian dengan Metode DCF
Konservatif Moderat Agresif
PV of Free Cash Flows [Rp miliar] 75 79 83 PV Terminal Value [Rp miliar] 985 1.036 1.088 Non-Operating Asset [Rp miliar] 56 56 56 Net Debt [Rp miliar] (67) (67) (67) Total Equity Value [Rp miliar] 1.048 1.048 1.048 Number of Share [juta saham] 4.007 4.007 4.007 Fair Value per Share [Rp] 260 275 290
Sumber: Estimasi Pefindo Divisi Valuasi Saham & Indexing
TARGET HARGA
“Pernyataan disclaimer pada halaman
akhir merupakan bagian tak
terpisahkan dari dokumen ini”
www.pefindo.com
KMI Wire and Cable, Tbk
9 Agustus 2012 Halaman 13 dari 15
Tabel 6: Perbandingan GCM
KBLI KBLM JECC SCCO VOKS Rata-rata
Penilaian, 8 Agustus 2012
P/E, [x] 7,60 n.a 10,17 5,34 8,27 7,85
P/BV, [x] 0,98 0,59 2,67 1,92 1,83 1,60
Sumber: Bloomberg, Estimasi Pefindo Divisi Valuasi Saham & Indexing
Tabel 7: Ringkasan Penilaian Metode GCM
Multiples
(x)
Est, EPS
(Rp)
Est, BV/Share
(Rp)
Value
(Rp)
P/E 7,85 31 - 245 P/BV 1.60 - 211 340
Sumber: Bloomberg, Estimasi Pefindo Divisi Valuasi Saham & Indexing
Tabel 8: Rekonsiliasi Nilai Wajar Nilai Wajar per Saham [Rp]
DCF GCM Rata-rata
Batas atas 290 340 305
Batas bawah 260 245 260
Bobot 70% 30%
Sumber: Bloomberg, Estimasi Pefindo Divisi Valuasi Saham & Indexing
“Pernyataan disclaimer pada halaman
akhir merupakan bagian tak
terpisahkan dari dokumen ini”
www.pefindo.com
KMI Wire and Cable, Tbk
9 Agustus 2012 Halaman 14 dari 15
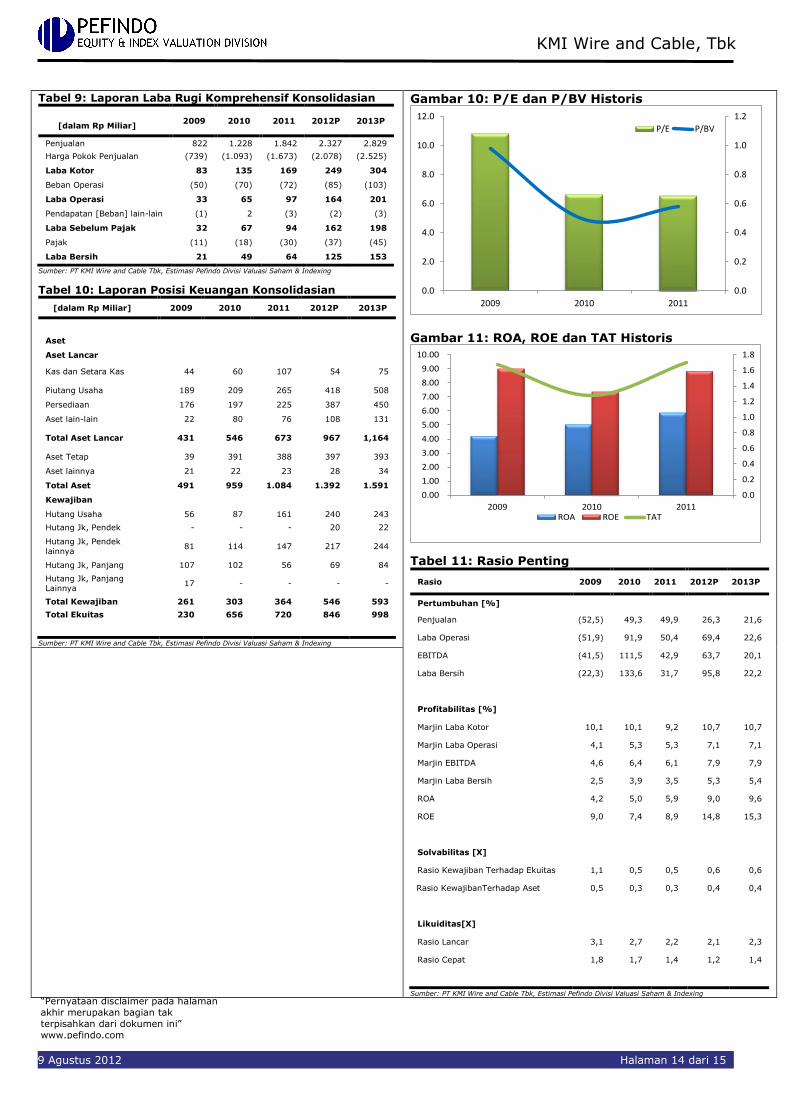
Tabel 9: Laporan Laba Rugi Komprehensif Konsolidasian
[dalam Rp Miliar]
2009 2010 2011 2012P 2013P
Penjualan 822 1.228 1.842 2.327 2.829
Harga Pokok Penjualan (739) (1.093) (1.673) (2.078) (2.525)
Laba Kotor 83 135 169 249 304
Beban Operasi (50) (70) (72) (85) (103)
Laba Operasi 33 65 97 164 201
Pendapatan [Beban] lain-lain (1) 2 (3) (2) (3)
Laba Sebelum Pajak 32 67 94 162 198
Pajak (11) (18) (30) (37) (45)
Laba Bersih 21 49 64 125 153
Sumber: PT KMI Wire and Cable Tbk, Estimasi Pefindo Divisi Valuasi Saham & Indexing
Tabel 10: Laporan Posisi Keuangan Konsolidasian
[dalam Rp Miliar] 2009 2010 2011 2012P 2013P
Aset
Aset Lancar
Kas dan Setara Kas 44 60 107 54 75
Piutang Usaha 189 209 265 418 508
Persediaan 176 197 225 387 450
Aset lain-lain 22 80 76 108 131
Total Aset Lancar 431 546 673 967 1,164
Aset Tetap 39 391 388 397 393
Aset lainnya 21 22 23 28 34
Total Aset 491 959 1.084 1.392 1.591
Kewajiban
Hutang Usaha 56 87 161 240 243
Hutang Jk, Pendek - - - 20 22
Hutang Jk, Pendek
lainnya 81 114 147 217 244
Hutang Jk, Panjang 107 102 56 69 84
Hutang Jk, Panjang
Lainnya 17 - - - -
Total Kewajiban 261 303 364 546 593
Total Ekuitas 230 656 720 846 998
Sumber: PT KMI Wire and Cable Tbk, Estimasi Pefindo Divisi Valuasi Saham & Indexing
Gambar 10: P/E dan P/BV Historis
0.0
0.2
0.4
0.6
0.8
1.0
1.2
0.0
2.0
4.0
6.0
8.0
10.0
12.0
2009 2010 2011
P/E P/BV
Gambar 11: ROA, ROE dan TAT Historis
0.0
0.2
0.4
0.6
0.8
1.0
1.2
1.4
1.6
1.8
0.00
1.00
2.00
3.00
4.00
5.00
6.00
7.00
8.00
9.00
10.00
2009 2010 2011ROA ROE TAT
Tabel 11: Rasio Penting
Rasio 2009 2010 2011 2012P 2013P
Pertumbuhan [%]
Penjualan (52,5) 49,3 49,9 26,3 21,6
Laba Operasi (51,9) 91,9 50,4 69,4 22,6
EBITDA (41,5) 111,5 42,9 63,7 20,1
Laba Bersih (22,3) 133,6 31,7 95,8 22,2
Profitabilitas [%]
Marjin Laba Kotor 10,1 10,1 9,2 10,7 10,7
Marjin Laba Operasi 4,1 5,3 5,3 7,1 7,1
Marjin EBITDA 4,6 6,4 6,1 7,9 7,9
Marjin Laba Bersih 2,5 3,9 3,5 5,3 5,4
ROA 4,2 5,0 5,9 9,0 9,6
ROE 9,0 7,4 8,9 14,8 15,3
Solvabilitas [X]
Rasio Kewajiban Terhadap Ekuitas 1,1 0,5 0,5 0,6 0,6
Rasio KewajibanTerhadap Aset 0,5 0,3 0,3 0,4 0,4
Likuiditas[X]
Rasio Lancar 3,1 2,7 2,2 2,1 2,3
Rasio Cepat 1,8 1,7 1,4 1,2 1,4
Sumber: PT KMI Wire and Cable Tbk, Estimasi Pefindo Divisi Valuasi Saham & Indexing

“Pernyataan disclaimer pada halaman
akhir merupakan bagian tak
terpisahkan dari dokumen ini”
www.pefindo.com
KMI Wire and Cable, Tbk
9 Agustus 2012 Halaman 15 dari 15
DISCLAIMER
Laporan ini dibuat berdasarkan sumber-sumber yang kami anggap terpercaya dan dapat
diandalkan, Namun kami tidak menjamin kelengkapan, keakuratan atau kecukupannya , Dengan
demikian kami tidak bertanggung jawab atas segala keputusan investasi yang diambi l berdasarkan laporan ini, Adapun asumsi, opini, dan perkiraan merupakan hasil dari pertimbangan internal kami per tanggal penilaian (cut-off date), dan kami dapat mengubah pertimbangan diatas sewaktu-waktu tanpa pemberitahuan terlebih dahulu. Kami tidak bertanggung jawab atas kekeliruan atau kelalaian yang terjadi akibat penggunaan laporan ini, Kinerja dimasa lalu tidak selalu dapat dijadikan acuan hasil masa depan , Laporan
ini bukan merupakan rekomendasi penawaran, pembelian atau menahan suatu saham ter tentu, Laporan ini mungkin tidak sesuai untuk beberapa investor, Seluruh opini dalam laporan ini telah disampaikan dengan itikad baik, namun sewaktu-waktu dapat berubah tanpa pemberitahuan terlebih dahulu, dan disajikan dengan benar per tanggal diterbitkan laporan ini, Harga, nilai, atau pendapatan dari setiap saham Perseroan yang disajikan dalam laporan ini kemungkinan dapat lebih rendah dari harapan pemodal, dan pemodal juga mungkin mendapatkan
pengembalian yang lebih rendah dari nilai investasi yang ditanamkan, Investasi didefinisikan sebagai pendapatan yang kemungkinan besar diterima dimasa depan, namun nilai dari
pendapatan yang akan diterima tersebut kemungkinan besar juga akan berfluktuasi , Untuk saham Perseroan yang penyajian laporan keuangannya didenominasi dalam mata uang selain Rupiah, perubahan nilai tukar mata uang tersebut kemungkinan dapat menurunkan nilai, harga, atau pendapatan investasi pemodal, Informasi dalam laporan ini bukan merupakan pertimbangan pajak dalam mengambil suatu keputusan investasi.
Target harga saham dalam Laporan ini merupakan nilai fundamental, bukan merupakan Nilai Pasar Wajar, dan bukan merupakan harga acuan transaksi yang diwajibkan oleh peraturan perundang-undangan yang berlaku. Laporan target harga saham yang diterbitkan oleh Pefindo Divisi Valuasi Saham dan Indexing bukan merupakan rekomendasi untuk membeli, menjual, atau menahan suatu saham tertentu,
dan tidak dapat dianggap sebagai nasehat investasi oleh Pefindo Divisi Valuasi Saham dan Indexing yang behubungan dengan cakupan Jasa Pefindo kepada, atau kaitannya kepada, beberapa pihak, termasuk emiten, penasehat keuangan, pialang saham, investment banks, institusi keuangan dan perantara keuangan, dalam kaitannya menerima imbalan atau keuntungan lainnya dari pihak tersebut.
Laporan ini tidak ditujukan untuk pemodal tertentu dan tidak dapat dijadikan bagian dari tujuan investasi terhadap suatu saham dan juga bukan merupakan rekomendasi investasi terhadap suatu saham tertentu atau suatu strategi investasi , Sebelum melakukan tindakan dari hasil laporan ini, pemodal disarankan untuk mempertimbangkan terlebih dahulu kesesuaian situasi dan kondisi dan, jika dibutuhkan, mintalah bantuan penasehat keuangan. PEFINDO memisahkan kegiatan Valuasi Saham dengan kegiatan Pemeringkatan untuk menjaga
independensi dan objektivitas dari proses dan produk kegiatan analitis , PEFINDO telah menetapkan kebijakan dan prosedur untuk menjaga kerahasiaan informasi non-publik tertentu yang diterima sehubungan dengan proses analitis, Keseluruhan proses, metodologi dan database yang digunakan dalam penyusunan Laporan Target Harga Referensi Saham ini secara keseluruhan adalah berbeda dengan proses, metodologi dan database yang digunakan PEFINDO dalam melakukan pemeringkatan.
Laporan ini dibuat dan disiapkan Pefindo Divisi Valuasi Saham & Indexing dengan tujuan untuk meningkatkan transparansi harga saham yang tercatat di Bursa Efek Indonesia , Laporan ini
juga bebas dari pengaruh tekanan atau paksaan dari Bursa maupun Perseroan yang dinilai , Pefindo Divisi Valuasi Saham & Indexing akan menerima imbalan sebesar Rp. 20.000.000,- masing-masing dari Bursa Efek Indonesia dan Perseroan yang dinilai untuk 2 (dua) kali pelaporan per tahun, Untuk keterangan lebih lanjut, dapat mengunjungi website kami di
http://www,pefindo,com Laporan ini dibuat dan disiapkan oleh Pefindo Divisi Valuasi Saham dan Indexing , Di Indonesia Laporan ini dipublikasikan pada website kami dan juga pada website Bursa Efek Indonesia .
Page 1 of 15
Contact: Equity & Index Valuation Division Phone: (6221) 7278 2380 [email protected]
“Disclaimer statement in the last page is an
integral part of this report”
www.pefindo.com
KMI Wire and Cable, Tbk Secondary Report
Equity Valuation
August 9th, 2012
Target Price
Low High 260 305
Cable
Historical Chart
0
50
100
150
200
250
0
500
1,000
1,500
2,000
2,500
3,000
3,500
4,000
4,500
Aug-11 Oct-11 Dec-11 Feb-12 Apr-12 Jun-12
KBLIJCI
JCI KBLI Source: Bloomberg
Stock Information Rp
Ticker code KBLI
Market price as of August 8th 2012 194
Market price – 52 week high 197
Market price – 52 week low 80
Market cap – 52 week high (bn) 789
Market cap – 52 week low (bn) 321
Stock Valuation Last Current
High 255 305
Low 225 260
Market Value Added & Market Risk
0
0.2
0.4
0.6
0.8
1
1.2
-80
-70
-60
-50
-40
-30
-20
-10
0
10
20
1Q11 1Q12
Mar
ket
Ris
k
MV
A
MVA Market Risk
Source: Bloomberg, Pefindo Equity & Index Valuation Division
Shareholders (%)
Javas Premier Venture Capital Limited 47.68
BNP Paribas Private Singapore c/o Hongkong and Shanghai Bank 8.69
GS LND Clear AC c/o Citibank, N.A 7.80
GSAF Risk Arbritage Investment 7.55
Public (each below 5% ownership) 28.28
Larger Production Capacity for Stronger Growth
PT KMI Wire and Cable Tbk (KBLI) is one of the Indonesia’s leading companies of cables among six companies that listed in IDX. It was
established in 1972 and start producing low voltage power and telephone cables in 1974 at its factory that located on a 10-hectare site in Cakung, East Jakarta. KBLI went public on June 8th, 1992 and officially changed its name from PT GT Kabel Indonesia Tbk to PT KMI Wire and Cable Tbk in 2008. KBLI’s main activities is to manufacture cables, aluminum and
copper wire and other cables material, including all types of components as well as other accessories and cable engineering and installation. To
respond the increasing cable demand, KBLI has upgraded its production capacity to 33,000 tons/year this year, consisting of 21,000 tons for copper power cables and 12,000 tons for aluminum power cables. More than 90% of KBLI’s products are marketed for domestic market with free market & distributor as the main buyer. Moreover, KBLI’s sales is also strengthened by its new product namely Aluminum Conductor with
Composite Core (ACCC) which already showed remarkable performance in these two years. Through long experience in this industry, larger production capacity as well as the robust cable demand in domestic, we are positive to view that KBLI is ready to pursue stronger revenue growth in the years ahead.
“Disclaimer statement in the last page
is an integral part of this report”
www.pefindo.com
KMI Wire and Cable, Tbk
August 9th, 2012 Page 2 of 15
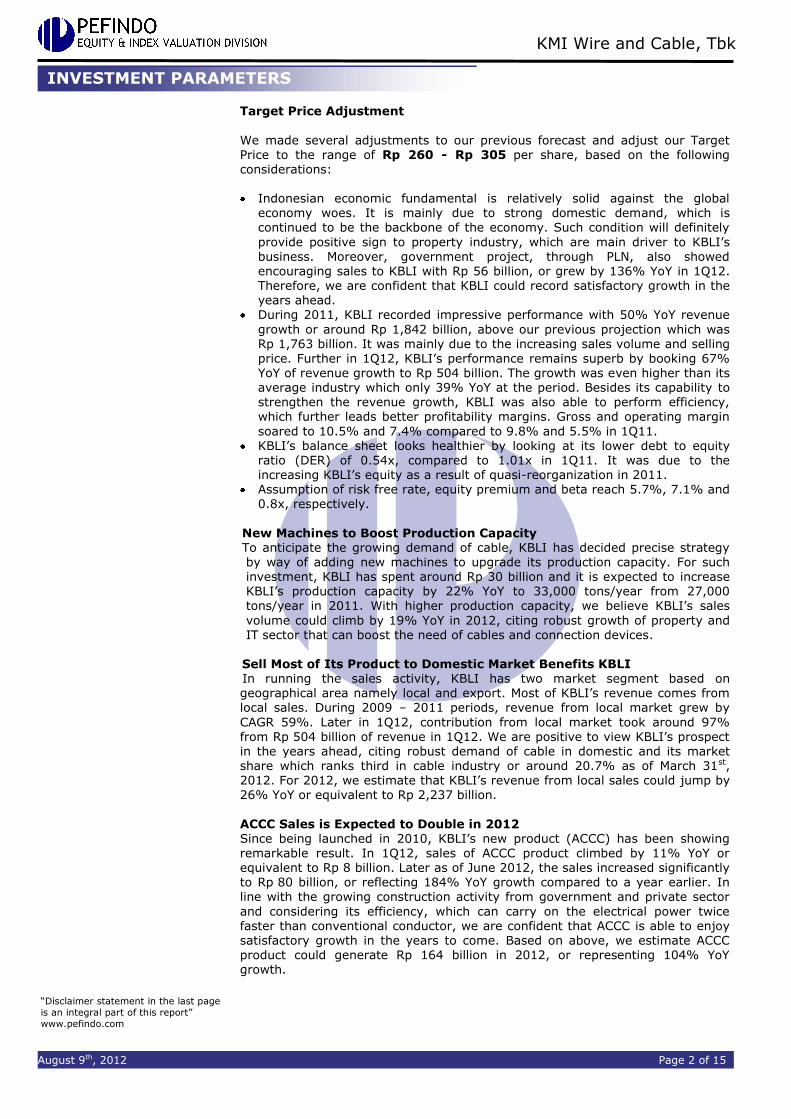
Target Price Adjustment
We made several adjustments to our previous forecast and adjust our Target Price to the range of Rp 260 - Rp 305 per share, based on the following considerations:
Indonesian economic fundamental is relatively solid against the global
economy woes. It is mainly due to strong domestic demand, which is continued to be the backbone of the economy. Such condition will definitely
provide positive sign to property industry, which are main driver to KBLI’s business. Moreover, government project, through PLN, also showed encouraging sales to KBLI with Rp 56 billion, or grew by 136% YoY in 1Q12. Therefore, we are confident that KBLI could record satisfactory growth in the years ahead.
During 2011, KBLI recorded impressive performance with 50% YoY revenue
growth or around Rp 1,842 billion, above our previous projection which was Rp 1,763 billion. It was mainly due to the increasing sales volume and selling
price. Further in 1Q12, KBLI’s performance remains superb by booking 67% YoY of revenue growth to Rp 504 billion. The growth was even higher than its average industry which only 39% YoY at the period. Besides its capability to strengthen the revenue growth, KBLI was also able to perform efficiency, which further leads better profitability margins. Gross and operating margin
soared to 10.5% and 7.4% compared to 9.8% and 5.5% in 1Q11. KBLI’s balance sheet looks healthier by looking at its lower debt to equity
ratio (DER) of 0.54x, compared to 1.01x in 1Q11. It was due to the increasing KBLI’s equity as a result of quasi-reorganization in 2011.
Assumption of risk free rate, equity premium and beta reach 5.7%, 7.1% and 0.8x, respectively.
New Machines to Boost Production Capacity To anticipate the growing demand of cable, KBLI has decided precise strategy
by way of adding new machines to upgrade its production capacity. For such investment, KBLI has spent around Rp 30 billion and it is expected to increase KBLI’s production capacity by 22% YoY to 33,000 tons/year from 27,000
tons/year in 2011. With higher production capacity, we believe KBLI’s sales
volume could climb by 19% YoY in 2012, citing robust growth of property and IT sector that can boost the need of cables and connection devices.
Sell Most of Its Product to Domestic Market Benefits KBLI In running the sales activity, KBLI has two market segment based on geographical area namely local and export. Most of KBLI’s revenue comes from local sales. During 2009 – 2011 periods, revenue from local market grew by
CAGR 59%. Later in 1Q12, contribution from local market took around 97% from Rp 504 billion of revenue in 1Q12. We are positive to view KBLI’s prospect in the years ahead, citing robust demand of cable in domestic and its market share which ranks third in cable industry or around 20.7% as of March 31st, 2012. For 2012, we estimate that KBLI’s revenue from local sales could jump by 26% YoY or equivalent to Rp 2,237 billion.
ACCC Sales is Expected to Double in 2012 Since being launched in 2010, KBLI’s new product (ACCC) has been showing
remarkable result. In 1Q12, sales of ACCC product climbed by 11% YoY or equivalent to Rp 8 billion. Later as of June 2012, the sales increased significantly to Rp 80 billion, or reflecting 184% YoY growth compared to a year earlier. In line with the growing construction activity from government and private sector
and considering its efficiency, which can carry on the electrical power twice faster than conventional conductor, we are confident that ACCC is able to enjoy satisfactory growth in the years to come. Based on above, we estimate ACCC product could generate Rp 164 billion in 2012, or representing 104% YoY growth.
INVESTMENT PARAMETERS

“Disclaimer statement in the last page
is an integral part of this report”
www.pefindo.com
KMI Wire and Cable, Tbk
August 9th, 2012 Page 3 of 15
Business Prospects Sustaining great performance a year earlier, the Indonesian economy is expected to grow above 6% this year, despite a global economic uncertainty
stemming from financial crisis in Europe and USA. The growing development of
housing/office, industrial as well as infrastructure which owned by government and some private projects is believed to boost the need of cable and connection devices in domestic. Accordingly, national cable industry is predicted to grow 20% YoY this year. Moreover, government plans to build 10,000 megawatt power plant and Master Plan for Acceleration and Expansion Economic Development of Indonesia (MP3EI) also could fuel high demand of cable in the long run. On the other side, KBLI is equipped by new machines for larger
production capacity and ACCC product. Therefore, we keep in line with our previous projection with CAGR 9% of revenue growth in 2012 – 2016 periods. Table 1: Performance Summary
2009 2010 2011 2012P 2013P
Revenue (Rp bn) 822 1,228 1,842 2,327 2,829
Pre-tax Profit (Rp bn) 32 67 94 162 198
Net Profit (Rp bn) 21 49 64 125 153
EPS (Rp) 5 12 16 31 38
EPS Growth (%) (0.2) 1.3 0.3 1.0 0.2
P/E (x) 10.8 6.6 6.5 6.2* 5.1*
PBV (x) 1.0 0.5 0.6 0.9* 0 .8*
Source: PT KMI Wire and Cable Tbk., Pefindo Equity & Index Valuation Division Estimates Notes: * Based on Share Price as of August 8
th, 2012 – Rp 194 / share
“Disclaimer statement in the last page
is an integral part of this report”
www.pefindo.com
KMI Wire and Cable, Tbk
August 9th, 2012 Page 4 of 15
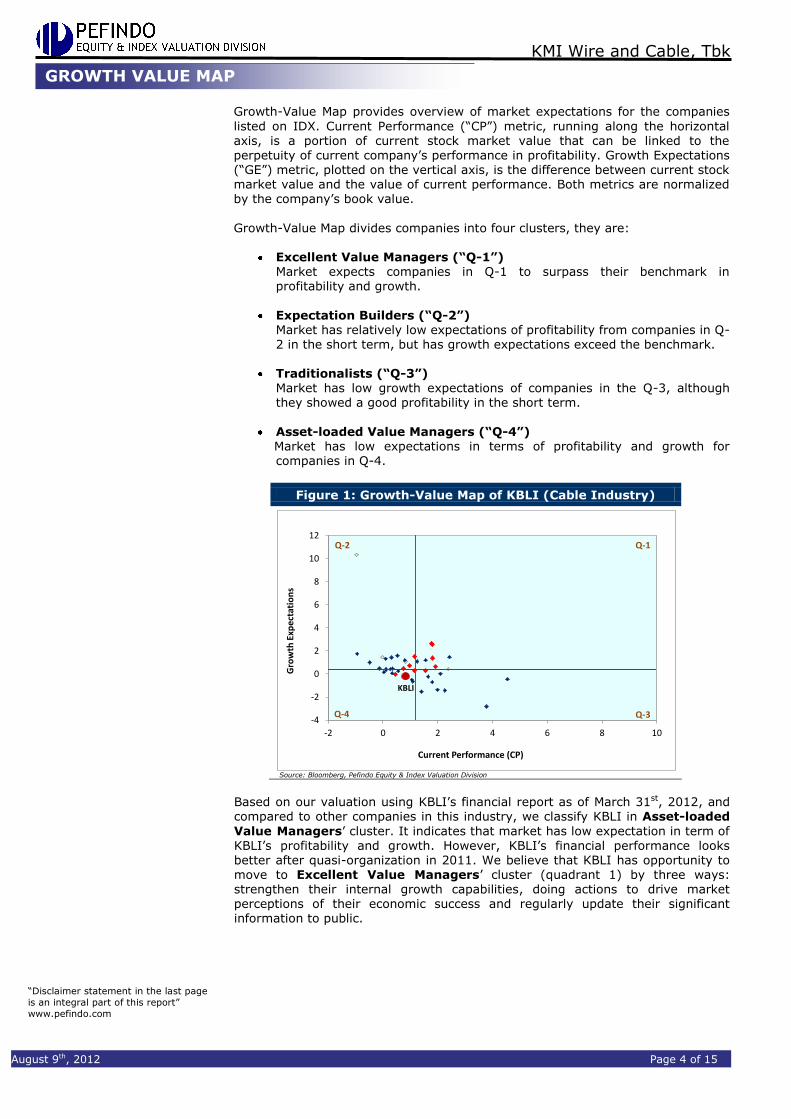
Growth-Value Map provides overview of market expectations for the companies
listed on IDX. Current Performance (“CP”) metric, running along the horizontal axis, is a portion of current stock market value that can be linked to the perpetuity of current company’s performance in profitability. Growth Expectations (“GE”) metric, plotted on the vertical axis, is the difference between current stock market value and the value of current performance. Both metrics are normalized by the company’s book value.
Growth-Value Map divides companies into four clusters, they are:
Excellent Value Managers (“Q-1”) Market expects companies in Q-1 to surpass their benchmark in profitability and growth.
Expectation Builders (“Q-2”) Market has relatively low expectations of profitability from companies in Q-2 in the short term, but has growth expectations exceed the benchmark.
Traditionalists (“Q-3”)
Market has low growth expectations of companies in the Q-3, although they showed a good profitability in the short term.
Asset-loaded Value Managers (“Q-4”) Market has low expectations in terms of profitability and growth for companies in Q-4.
Figure 1: Growth-Value Map of KBLI (Cable Industry)
-4
-2
0
2
4
6
8
10
12
-2 0 2 4 6 8 10
Gro
wth
Exp
ecta
tio
ns
Current Performance (CP)
Q-1
Q-3
Q-2
Q-4
KBLI
Source: Bloomberg, Pefindo Equity & Index Valuation Division
Based on our valuation using KBLI’s financial report as of March 31st, 2012, and compared to other companies in this industry, we classify KBLI in Asset-loaded
Value Managers’ cluster. It indicates that market has low expectation in term of
KBLI’s profitability and growth. However, KBLI’s financial performance looks better after quasi-organization in 2011. We believe that KBLI has opportunity to move to Excellent Value Managers’ cluster (quadrant 1) by three ways: strengthen their internal growth capabilities, doing actions to drive market perceptions of their economic success and regularly update their significant information to public.
GROWTH VALUE MAP
“Disclaimer statement in the last page
is an integral part of this report”
www.pefindo.com
KMI Wire and Cable, Tbk
August 9th, 2012 Page 5 of 15
Domestic Demand Remains the Main Engine for Indonesia’s Economic Growth in 2012
Indonesia’s economic fundamentals will remain strong despite expected effect of current global crisis that may cause world economic slowdown. PEFINDO estimates that Indonesia’s economic growth will slightly down to 6.2% YoY in 2012, against 6.5% YoY in 2011. The growth locomotive would be contributed from private consumption with the support of continued consumers’ optimism, manageable inflation, lower interest rate, and increasing per capita income. Indonesia’s per capita income reached USD 3,543 in 2011, and may break
USD 4,000 in 2012, compared to USD 3,000 in 2010. Meanwhile, investment realization in 2011 reached Rp 251.3 trillion or rose by 20.5% YoY compared to 2010 period. With population composition is dominated by productive age population (around 60%) and increasing international perception of Indonesia’s economy development that reflected from the inclusion of Indonesia into investment grade by Fitch on December 2011 and by Moody’s on January 2012,
then we believe that Indonesia will able to maintain its favorable growth in the
coming years. Such good economic figure is enjoyed by KBLI by looking at its sales from domestic market which grew 70% YoY or reached Rp 488 billion in 1Q12.
Table 2: Indonesia’s Economic Indicator 2008 2009 2010 2011
GDP Growth (%, YoY)
Inflation rate (%, YoY)
Exchange rate* (Rp/USD)
SBI rate (%)
6.1
11.06
9,136
9.25
4.5
2.78
9,680
6.50
6.1
6.96
10,398
6.5
6.5
3.79
8,779
6.0
* Bank Indonesia Middle Rate Average Source: BPS, Bank Indonesia, Pefindo Equity & Index Valuation Division
Providing Diverse and High-quality Products In order to fulfill market demand, KBLI produces more than 2,000 different types and size of cables, including low and medium voltage power cables, telephone cables, control cables and other special types of cable such as data/instrument cable, flame retardant and fire resistant cable, nylon sheated cable, and others.
KBLI uses the brand of “Kabelmetal” for domestic market and “KMI” for export. From those products, KBLI classifies its products into three main categories,
namely low-voltage cable, medium-voltage cable and specific cable. Low-voltage cable has power up to 1 kV, while medium-voltage cable has up to 36 kV and specific cables are made based on order. Besides that, KBLI also has Aluminum Conductor with Composite Core (ACCC) which we believe will have bright prospect considering its efficiency compared to conventional conductors.
Currently, KBLI is known as reliable cable producer due to having high-quality products with both national and international standards. Its national standards include Standar Nasional Indonesia (SNI) and Standar Perusahaan Listrik Negara (SPLN). While the international standards are International Electrotechnical Commission (IEC), Australian Standards (AS), British Standard (BS), Verband Deutscher Elektrotechniker (VDE), Japanese Industrial Standard (JIS) and Insulated Cable Engineers Association/National Electrical Manufacturers
Association (ICEA/NEMA). Thanks to its experience and well brand image in this
industry, KBLI’s market share ranked third among six companies that listed in IDX, with 20.7% as of March 31st, 2012.
BUSINESS INFORMATION
“Disclaimer statement in the last page
is an integral part of this report”
www.pefindo.com
KMI Wire and Cable, Tbk
August 9th, 2012 Page 6 of 15
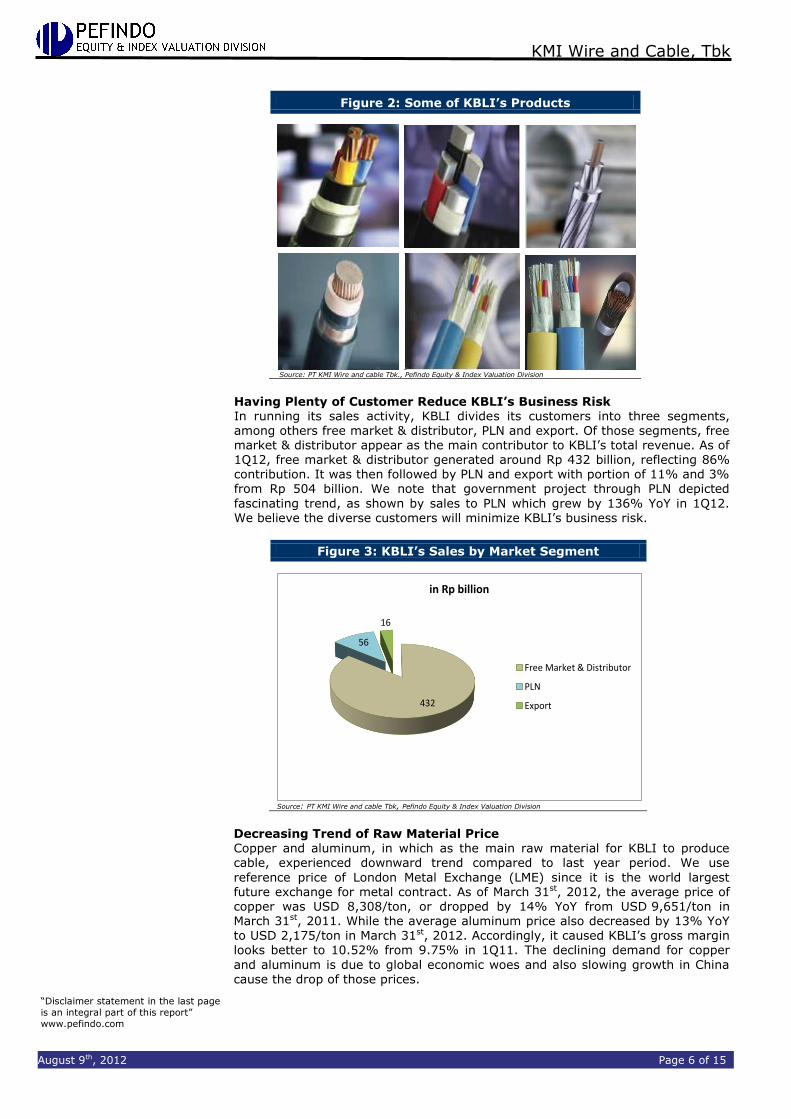
Figure 2: Some of KBLI’s Products
Source: PT KMI Wire and cable Tbk., Pefindo Equity & Index Valuation Division
Having Plenty of Customer Reduce KBLI’s Business Risk In running its sales activity, KBLI divides its customers into three segments, among others free market & distributor, PLN and export. Of those segments, free market & distributor appear as the main contributor to KBLI’s total revenue. As of 1Q12, free market & distributor generated around Rp 432 billion, reflecting 86% contribution. It was then followed by PLN and export with portion of 11% and 3% from Rp 504 billion. We note that government project through PLN depicted
fascinating trend, as shown by sales to PLN which grew by 136% YoY in 1Q12. We believe the diverse customers will minimize KBLI’s business risk.
Figure 3: KBLI’s Sales by Market Segment
432
56
16
in Rp billion
Free Market & Distributor
PLN
Export
Source: PT KMI Wire and cable Tbk, Pefindo Equity & Index Valuation Division Decreasing Trend of Raw Material Price
Copper and aluminum, in which as the main raw material for KBLI to produce cable, experienced downward trend compared to last year period. We use
reference price of London Metal Exchange (LME) since it is the world largest future exchange for metal contract. As of March 31st, 2012, the average price of copper was USD 8,308/ton, or dropped by 14% YoY from USD 9,651/ton in March 31st, 2011. While the average aluminum price also decreased by 13% YoY to USD 2,175/ton in March 31st, 2012. Accordingly, it caused KBLI’s gross margin looks better to 10.52% from 9.75% in 1Q11. The declining demand for copper
and aluminum is due to global economic woes and also slowing growth in China cause the drop of those prices.

“Disclaimer statement in the last page
is an integral part of this report”
www.pefindo.com
KMI Wire and Cable, Tbk
August 9th, 2012 Page 7 of 15
Figure 4: Price of Copper and Aluminum
-
2,000
4,000
6,000
8,000
10,000
12,000
-
500
1,000
1,500
2,000
2,500
3,000
Jan
-11
Feb
-11
Mar
-11
Ap
r-1
1
May
-11
Jun
-11
Jul-
11
Au
g-1
1
Sep
-11
Oct
-11
No
v-1
1
De
c-1
1
Jan
-12
Feb
-12
Mar
-12
Ap
r-1
2
May
-12
Jun
-12
USDUSD
Aluminum Copper
Source: PT KMI Wire and cable Tbk., Pefindo Equity & Index Valuation Division
“Disclaimer statement in the last page
is an integral part of this report”
www.pefindo.com
KMI Wire and Cable, Tbk
August 9th, 2012 Page 8 of 15
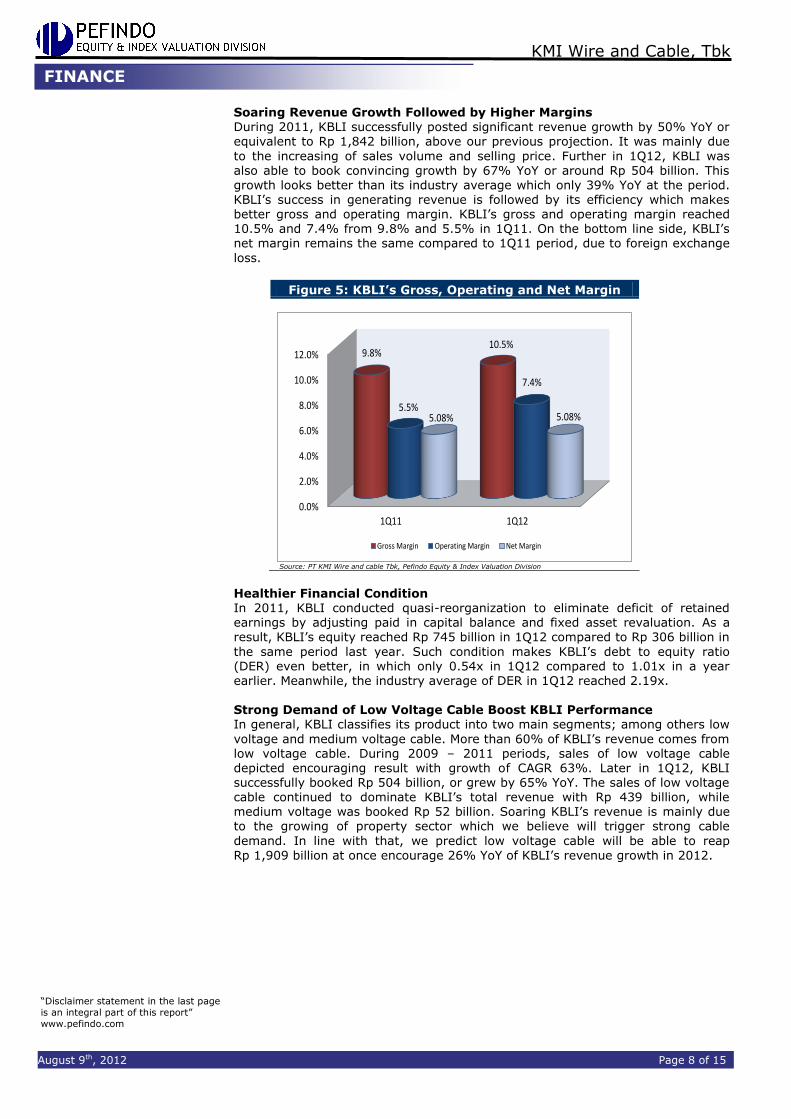
Soaring Revenue Growth Followed by Higher Margins
During 2011, KBLI successfully posted significant revenue growth by 50% YoY or equivalent to Rp 1,842 billion, above our previous projection. It was mainly due
to the increasing of sales volume and selling price. Further in 1Q12, KBLI was also able to book convincing growth by 67% YoY or around Rp 504 billion. This growth looks better than its industry average which only 39% YoY at the period. KBLI’s success in generating revenue is followed by its efficiency which makes better gross and operating margin. KBLI’s gross and operating margin reached 10.5% and 7.4% from 9.8% and 5.5% in 1Q11. On the bottom line side, KBLI’s net margin remains the same compared to 1Q11 period, due to foreign exchange
loss.
Figure 5: KBLI’s Gross, Operating and Net Margin
0.0%
2.0%
4.0%
6.0%
8.0%
10.0%
12.0%
1Q11 1Q12
9.8%10.5%
5.5%
7.4%
5.08% 5.08%
Gross Margin Operating Margin Net Margin
Source: PT KMI Wire and cable Tbk, Pefindo Equity & Index Valuation Division
Healthier Financial Condition
In 2011, KBLI conducted quasi-reorganization to eliminate deficit of retained earnings by adjusting paid in capital balance and fixed asset revaluation. As a result, KBLI’s equity reached Rp 745 billion in 1Q12 compared to Rp 306 billion in
the same period last year. Such condition makes KBLI’s debt to equity ratio (DER) even better, in which only 0.54x in 1Q12 compared to 1.01x in a year earlier. Meanwhile, the industry average of DER in 1Q12 reached 2.19x. Strong Demand of Low Voltage Cable Boost KBLI Performance In general, KBLI classifies its product into two main segments; among others low
voltage and medium voltage cable. More than 60% of KBLI’s revenue comes from low voltage cable. During 2009 – 2011 periods, sales of low voltage cable depicted encouraging result with growth of CAGR 63%. Later in 1Q12, KBLI successfully booked Rp 504 billion, or grew by 65% YoY. The sales of low voltage cable continued to dominate KBLI’s total revenue with Rp 439 billion, while medium voltage was booked Rp 52 billion. Soaring KBLI’s revenue is mainly due to the growing of property sector which we believe will trigger strong cable
demand. In line with that, we predict low voltage cable will be able to reap
Rp 1,909 billion at once encourage 26% YoY of KBLI’s revenue growth in 2012.
FINANCE

“Disclaimer statement in the last page
is an integral part of this report”
www.pefindo.com
KMI Wire and Cable, Tbk
August 9th, 2012 Page 9 of 15
Figure 6: Sales of Low Voltage Cable
563
811
1,501
1,909
-
500
1,000
1,500
2,000
2,500
2009 2010 2011 2012P
in R
p b
illi
on
Low Voltage Cable
Source: PT KMI Wire and cable Tbk, Pefindo Equity & Index Valuation Division
Bright Prospect of ACCC Product To meet the varying cable demand, KBLI successfully developed its new product
namely Aluminum Conductor with Composite Core (ACCC) since 2010. At the period, the production, shipment and its installation have carried out by PLN in Sumatera. We believe ACCC product has bright future since it is capable to carry on the electrical power twice than conventional conductor, thus make it more efficient. In 1Q12, sales of ACCC product climbed by 11% YoY or equivalent to Rp 8 billion. Later in 1H12, the sales increased significantly to Rp 80 billion, or reflecting 184% YoY of growth compared to a year earlier. Considering the
growing cable demand in domestic and its efficiency, we believe ACCC will be able to contribute 7% to KBLI’s total revenue, or hit Rp 164 billion in 2012.
Figure 7: Sales of ACCC Product
8
28
9
80
0
10
20
30
40
50
60
70
80
90
1Q11 1H11 1Q12 1H12
in R
p b
illi
on
ACCC's Sales
Source: PT KMI Wire and cable Tbk, Pefindo Equity & Index Valuation Division
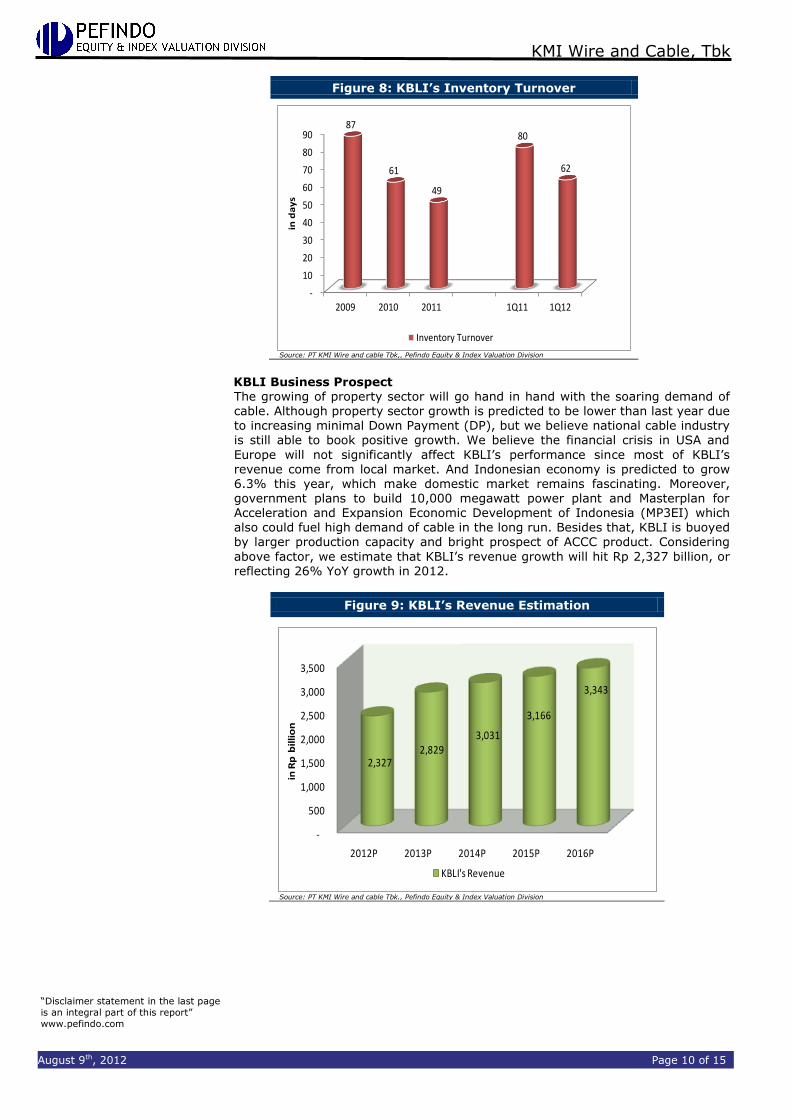
Faster Inventory Turnover Compared to Average Industry KBLI managed to book better inventory turnover, in which indicate its success in
converting inventory into sales. In 2009, KBLI’s inventory turnover was 86 days. Furthermore, it has turn into only 49 days in 2011. Later in 1Q12, its inventory turnover was also better with 62 days than last year period which was 80 days. Compared to average industry, KBLI’s performance in 1Q12 looks even better since the average industry turnover was as high as 75 days. Amazingly, KBLI is also able to record better cash conversion cycle, from 140 days in 2009 to 66
days in 2011. It continued in 1Q12, its cash conversion cycle was only 75 days, while in 1Q11 was 95 days.
“Disclaimer statement in the last page
is an integral part of this report”
www.pefindo.com
KMI Wire and Cable, Tbk
August 9th, 2012 Page 10 of 15
Figure 8: KBLI’s Inventory Turnover
-
10
20
30
40
50
60
70
80
90
2009 2010 2011 1Q11 1Q12
87
61
49
80
62
in d
ay
s
Inventory Turnover
Source: PT KMI Wire and cable Tbk,, Pefindo Equity & Index Valuation Division
KBLI Business Prospect The growing of property sector will go hand in hand with the soaring demand of cable. Although property sector growth is predicted to be lower than last year due to increasing minimal Down Payment (DP), but we believe national cable industry is still able to book positive growth. We believe the financial crisis in USA and
Europe will not significantly affect KBLI’s performance since most of KBLI’s revenue come from local market. And Indonesian economy is predicted to grow 6.3% this year, which make domestic market remains fascinating. Moreover, government plans to build 10,000 megawatt power plant and Masterplan for Acceleration and Expansion Economic Development of Indonesia (MP3EI) which also could fuel high demand of cable in the long run. Besides that, KBLI is buoyed by larger production capacity and bright prospect of ACCC product. Considering
above factor, we estimate that KBLI’s revenue growth will hit Rp 2,327 billion, or reflecting 26% YoY growth in 2012.
Figure 9: KBLI’s Revenue Estimation
-
500
1,000
1,500
2,000
2,500
3,000
3,500
2012P 2013P 2014P 2015P 2016P
2,327 2,829
3,031
3,166
3,343
in R
p b
illi
on
KBLI's Revenue
Source: PT KMI Wire and cable Tbk., Pefindo Equity & Index Valuation Division
“Disclaimer statement in the last page
is an integral part of this report”
www.pefindo.com
KMI Wire and Cable, Tbk
August 9th, 2012 Page 11 of 15
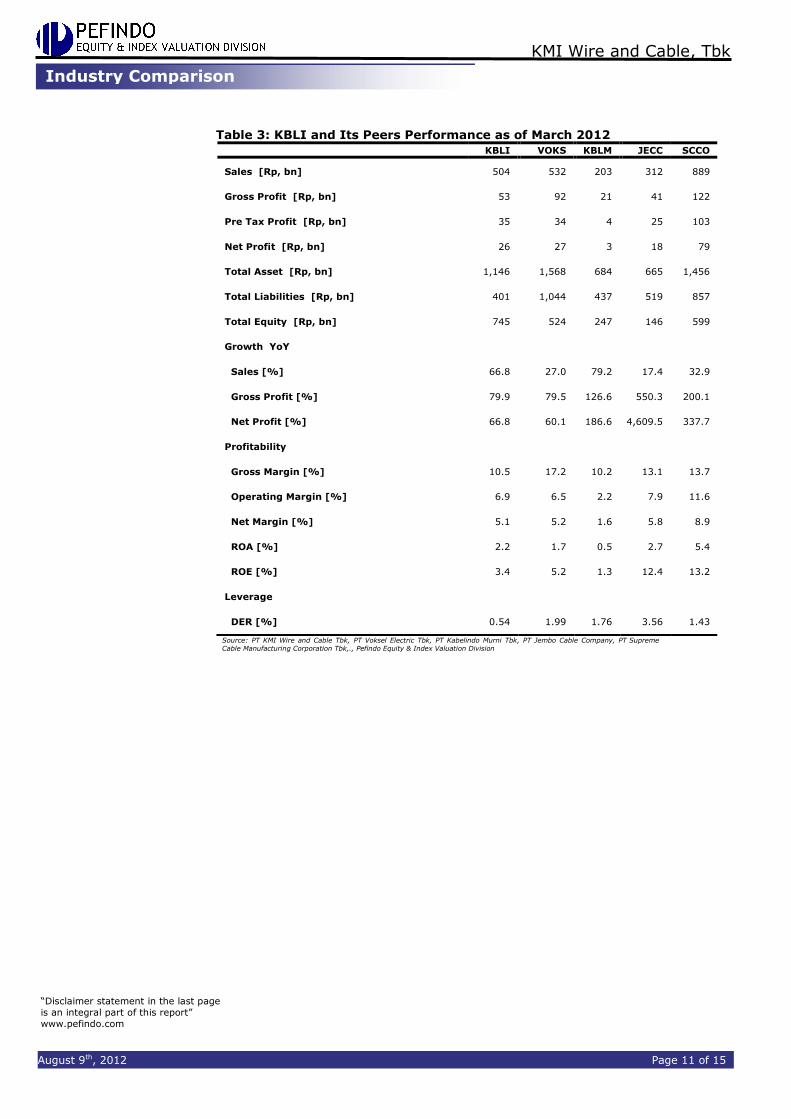
Table 3: KBLI and Its Peers Performance as of March 2012
KBLI VOKS KBLM JECC SCCO
Sales [Rp, bn] 504 532 203 312 889
Gross Profit [Rp, bn] 53 92 21 41 122
Pre Tax Profit [Rp, bn] 35 34 4 25 103
Net Profit [Rp, bn] 26 27 3 18 79
Total Asset [Rp, bn] 1,146 1,568 684 665 1,456
Total Liabilities [Rp, bn] 401 1,044 437 519 857
Total Equity [Rp, bn] 745 524 247 146 599
Growth YoY
Sales [%] 66.8 27.0 79.2 17.4 32.9
Gross Profit [%] 79.9 79.5 126.6 550.3 200.1
Net Profit [%] 66.8 60.1 186.6 4,609.5 337.7
Profitability
Gross Margin [%] 10.5 17.2 10.2 13.1 13.7
Operating Margin [%] 6.9 6.5 2.2 7.9 11.6
Net Margin [%] 5.1 5.2 1.6 5.8 8.9
ROA [%] 2.2 1.7 0.5 2.7 5.4
ROE [%] 3.4 5.2 1.3 12.4 13.2
Leverage
DER [%] 0.54 1.99 1.76 3.56 1.43
Source: PT KMI Wire and Cable Tbk, PT Voksel Electric Tbk, PT Kabelindo Murni Tbk, PT Jembo Cable Company, PT Supreme Cable Manufacturing Corporation Tbk,., Pefindo Equity & Index Valuation Division
Industry Comparison

“Disclaimer statement in the last page
is an integral part of this report”
www.pefindo.com
KMI Wire and Cable, Tbk
August 9th, 2012 Page 12 of 15
VALUATION
Methodology We apply Discounted Cash Flow (DCF) method as the main valuation approach considering the income growth is a value driver in KBLI instead of
asset growth. Furthermore, we also apply Guideline Company Method (GCM) as comparison method. This valuation is based on 100% KBLI’s shares price as of August 8th, 2012,
using KBLI’s financial report as of March 31st, 2012 for our fundamental analysis.
Value Estimation
We use Cost of Capital of 10.9% and Cost of Equity of 11.2% based on the following assumption:
Table 4: Assumption
Risk free rate [%]* 5.7
Risk premium [%]* 7.1
Beta [x]* 0.8
Cost of Equity [%] 11.2
Marginal tax rate [%] 25.0
Debt to Equity Ratio [x] 0.09
WACC [%] 10.9 Source: Bloomberg, Pefindo Equity & Index Valuation Division Estimates Notes: *As of August 8
th, 2012
Target price for 12 months based on valuation as per August 8th, 2012 is as follows:
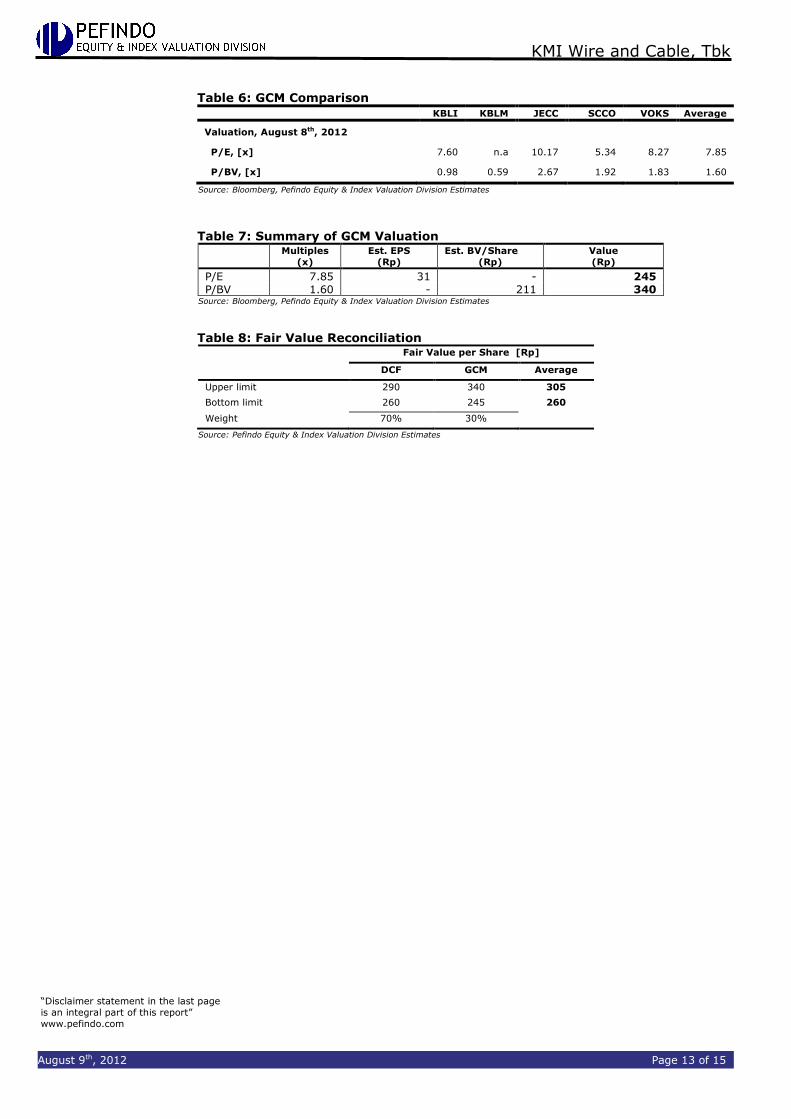
Using DCF method with discount rate assumption 10.9% is Rp 260 -
Rp 290 per share. Using GCM method (PBV 1.60X and P/E 7.85X) is Rp 245 - Rp 340
per share.
In order to obtain a value which represents both value indications, we have weighted both DCF and GCM methods by 70%:30%. Based on the above calculation, target price of KBLI for 12 month is Rp 260 - Rp 305 per share.
Table 5: Summary of DCF Method Valuation
Conservative Moderate Aggressive
PV of Free Cash Flows [Rp bn] 75 79 83 PV Terminal Value [Rp bn] 985 1,036 1,088 Non-Operating Assets- [Rp bn] 56 56 56 Net Debt [Rp bn] (67) (67) (67) Total Equity Value [Rp bn] 1,048 1,104 1,160 Number of Share [mn shares] 4,007 4,007 4,007 Fair Value per Share [Rp] 260 275 290 Source: Pefindo Equity & Index Valuation Division Estimates
TARGET PRICE
“Disclaimer statement in the last page
is an integral part of this report”
www.pefindo.com
KMI Wire and Cable, Tbk
August 9th, 2012 Page 13 of 15
Table 6: GCM Comparison
KBLI KBLM JECC SCCO VOKS Average
Valuation, August 8th, 2012
P/E, [x] 7.60 n.a 10.17 5.34 8.27 7.85
P/BV, [x] 0.98 0.59 2.67 1.92 1.83 1.60
Source: Bloomberg, Pefindo Equity & Index Valuation Division Estimates
Table 7: Summary of GCM Valuation
Multiples
(x)
Est. EPS
(Rp)
Est. BV/Share
(Rp)
Value
(Rp)
P/E 7.85 31 - 245 P/BV 1.60 - 211 340
Source: Bloomberg, Pefindo Equity & Index Valuation Division Estimates
Table 8: Fair Value Reconciliation Fair Value per Share [Rp]
DCF GCM Average
Upper limit 290 340 305
Bottom limit 260 245 260
Weight 70% 30%
Source: Pefindo Equity & Index Valuation Division Estimates
“Disclaimer statement in the last page
is an integral part of this report”
www.pefindo.com
KMI Wire and Cable, Tbk
August 9th, 2012 Page 14 of 15
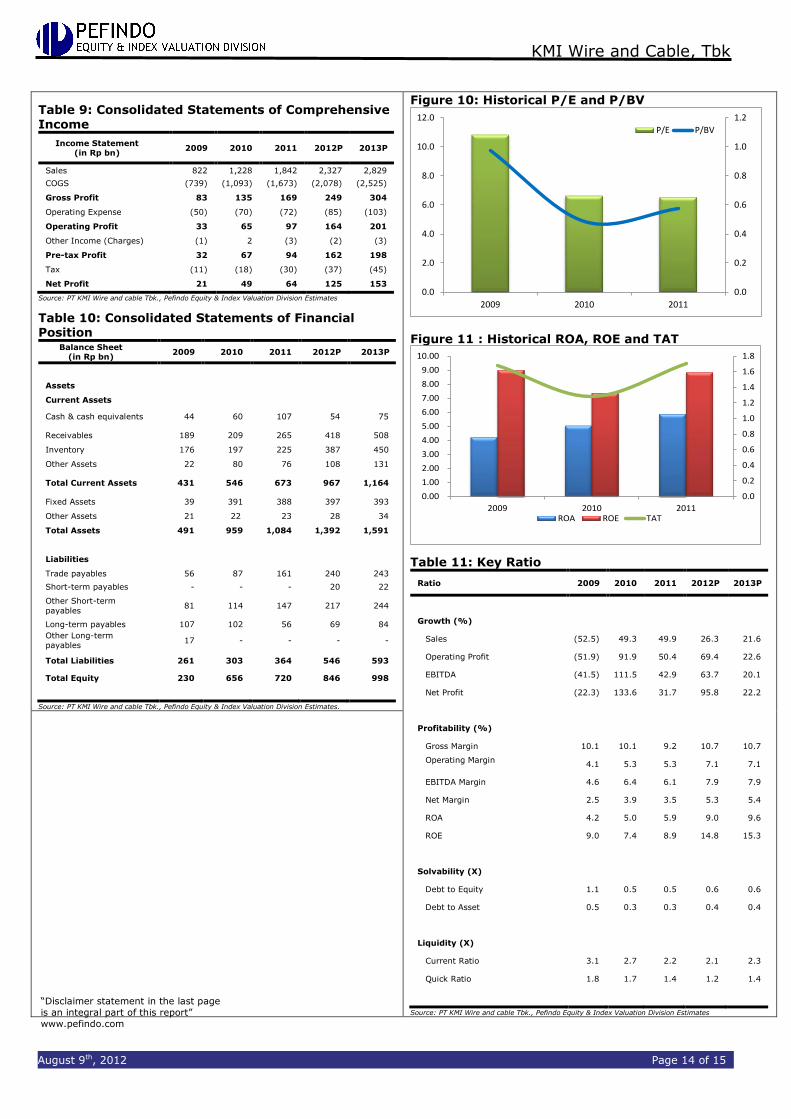
Table 9: Consolidated Statements of Comprehensive
Income
Income Statement (in Rp bn)
2009 2010 2011 2012P 2013P
Sales 822 1,228 1,842 2,327 2,829
COGS (739) (1,093) (1,673) (2,078) (2,525)
Gross Profit 83 135 169 249 304
Operating Expense (50) (70) (72) (85) (103)
Operating Profit 33 65 97 164 201
Other Income (Charges) (1) 2 (3) (2) (3)
Pre-tax Profit 32 67 94 162 198
Tax (11) (18) (30) (37) (45)
Net Profit 21 49 64 125 153
Source: PT KMI Wire and cable Tbk., Pefindo Equity & Index Valuation Division Estimates
Table 10: Consolidated Statements of Financial Position
Balance Sheet (in Rp bn)
2009 2010 2011 2012P 2013P
Assets
Current Assets
Cash & cash equivalents 44 60 107 54 75
Receivables 189 209 265 418 508
Inventory 176 197 225 387 450
Other Assets 22 80 76 108 131
Total Current Assets 431 546 673 967 1,164
Fixed Assets 39 391 388 397 393
Other Assets 21 22 23 28 34
Total Assets 491 959 1,084 1,392 1,591
Liabilities
Trade payables 56 87 161 240 243
Short-term payables - - - 20 22
Other Short-term
payables 81 114 147 217 244
Long-term payables 107 102 56 69 84
Other Long-term
payables 17 - - - -
Total Liabilities 261 303 364 546 593
Total Equity 230 656 720 846 998
Source: PT KMI Wire and cable Tbk., Pefindo Equity & Index Valuation Division Estimates.
Figure 10: Historical P/E and P/BV
0.0
0.2
0.4
0.6
0.8
1.0
1.2
0.0
2.0
4.0
6.0
8.0
10.0
12.0
2009 2010 2011
P/E P/BV
Figure 11 : Historical ROA, ROE and TAT
0.0
0.2
0.4
0.6
0.8
1.0
1.2
1.4
1.6
1.8
0.00
1.00
2.00
3.00
4.00
5.00
6.00
7.00
8.00
9.00
10.00
2009 2010 2011ROA ROE TAT
Table 11: Key Ratio
Ratio 2009 2010 2011 2012P 2013P
Growth (%)
Sales (52.5) 49.3 49.9 26.3 21.6
Operating Profit (51.9) 91.9 50.4 69.4 22.6
EBITDA (41.5) 111.5 42.9 63.7 20.1
Net Profit (22.3) 133.6 31.7 95.8 22.2
Profitability (%)
Gross Margin 10.1 10.1 9.2 10.7 10.7
Operating Margin
4.1 5.3 5.3 7.1 7.1
EBITDA Margin 4.6 6.4 6.1 7.9 7.9
Net Margin 2.5 3.9 3.5 5.3 5.4
ROA 4.2 5.0 5.9 9.0 9.6
ROE 9.0 7.4 8.9 14.8 15.3
Solvability (X)
Debt to Equity 1.1 0.5 0.5 0.6 0.6
Debt to Asset 0.5 0.3 0.3 0.4 0.4
Liquidity (X)
Current Ratio 3.1 2.7 2.2 2.1 2.3
Quick Ratio 1.8 1.7 1.4 1.2 1.4
Source: PT KMI Wire and cable Tbk., Pefindo Equity & Index Valuation Division Estimates
“Disclaimer statement in the last page
is an integral part of this report”
www.pefindo.com
KMI Wire and Cable, Tbk
August 9th, 2012 Page 15 of 15
DISCLAIMER
This report was prepared based on the trusted and reliable sources. Nevertheless, we do not guarantee its completeness, accuracy and adequacy. Therefore we do not responsible of any investment decision making based on this report. As for any assumptions, opinions and predictions were solely our internal judgments as per reporting date, and those judgments are
subject to change without further notice. We do not responsible for mistake and negligence occurred by using this report. Last performance could not always be used as reference for future outcome. This report is not an offering recommendation, purchase or holds particular shares. This report might not be suitable for some investors. All opinion in this report has been presented fairly as per issuing date with good intentions; however it could be change at any time without further notice. The price, value
or income from each share of the Company stated in this report might lower than the investor expectation and investor might obtain lower return than the invested amount. Investment is defined as the probable income that will be received in the future; nonetheless such return may possibly fluctuate. As for the Company which its share is denominated other than Rupiah, the foreign exchange fluctuation may reduce the value, price or investor investment return. This
report does not contain any information for tax consideration in investment decision making.
The share price target in this report is a fundamental value, not a fair market value nor a transaction price reference required by the regulations. The share price target issued by Pefindo Equity & Index Valuation Division is not a recommendation to buy, sell or hold particular shares and it could not be considered as an investment advice from Pefindo Equity & Index Valuation Division as its scope of service to, or
in relation to some parties, including listed companies, financial advisor, broker, investment bank, financial institution and intermediary, in correlation with receiving rewards or any other benefits from that parties. This report is not intended for particular investor and cannot be used as part of investment objective on particular shares and neither an investment recommendation on particular shares or an investment strategy. We strongly recommended investor to consider the suit able situation
and condition at first before making decision in relation with the figure in this report. If it is necessary, kindly contact your financial advisor.
PEFINDO keeps the activities of Equity Valuation separate from Ratings to preserve independence and objectivity of its analytical processes and products. PEFINDO has established policies and procedures to maintain the confidentiality of certain non-public information
received in connection with each analytical process. The entire process, methodology and the database used in the preparation of the Reference Share Price Target Report as a whole is different from the processes, methodologies and databases used PEFINDO in doing the rating. This report was prepared and composed by Pefindo Equity & Index Valuation Division with the objective to enhance shares price transparency of listed companies in Indonesia Stock Exchange (IDX). This report is also free of other party’s influence, pressure or force either from IDX or the listed company
which reviewed by Pefindo Equity & Index Valuation Division. Pefindo Equity & Index Valuation Division will earn reward amounting to Rp 20 mn each from IDX and the reviewed company for issuing report twice per year. For further information, please visit our website at http://www.pefindo.com This report is prepared and composed by Pefindo Equity & Index Valuation Division. In Indonesia, this report is published in our website and in IDX website .
Related Documents

![The KMI project · 2013-12-13 · The KMI project Yasumichi Aoki [Kobayashi-Maskawa Institute(KMI), Nagoya University] - at KMI2013 International Symposium - Dec. 11, 2013 Kobayashi-Maskawa](https://static.cupdf.com/doc/110x72/5f624edcf4d4f16dff22e608/the-kmi-2013-12-13-the-kmi-project-yasumichi-aoki-kobayashi-maskawa-institutekmi.jpg)