Overview ECG Yandi Ariffudin, dr

Welcome message from author
This document is posted to help you gain knowledge. Please leave a comment to let me know what you think about it! Share it to your friends and learn new things together.
Transcript
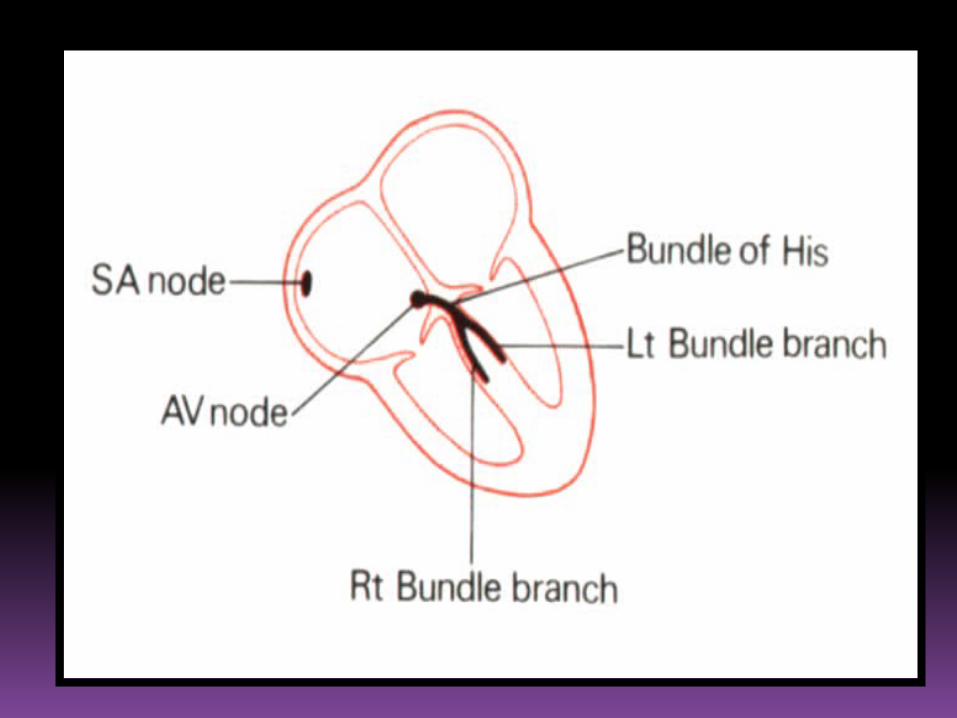
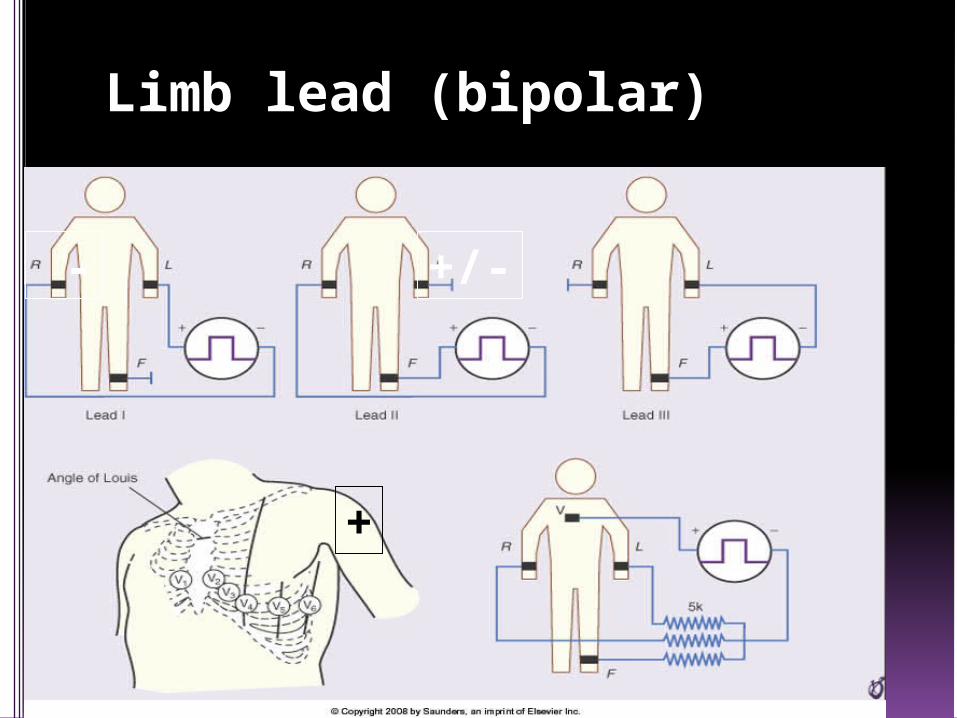
Limb lead (bipolar)
+/-
+
-
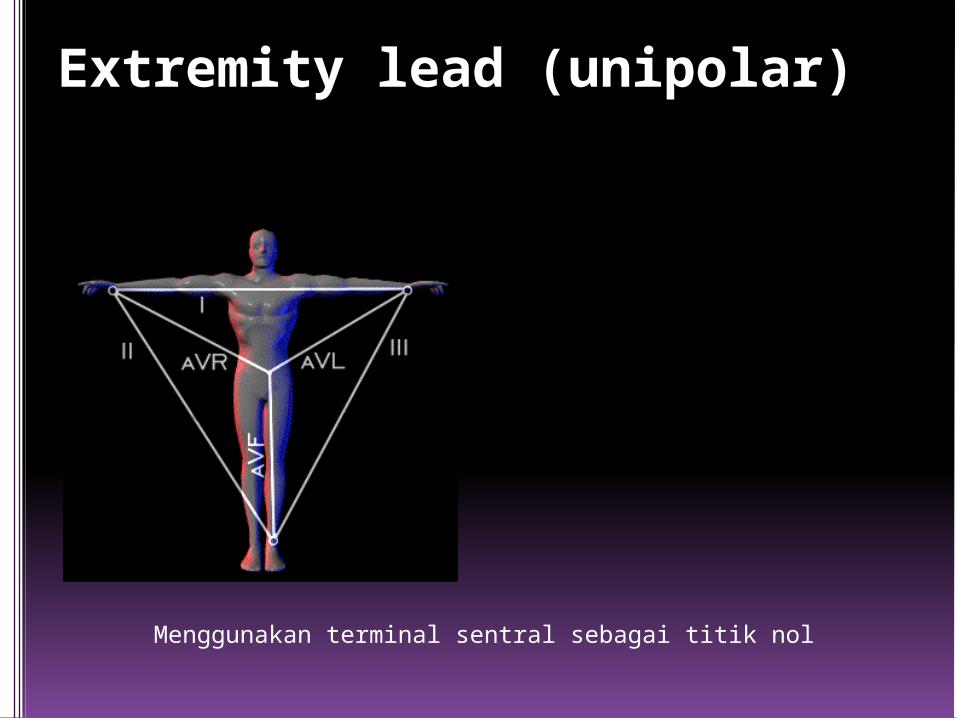
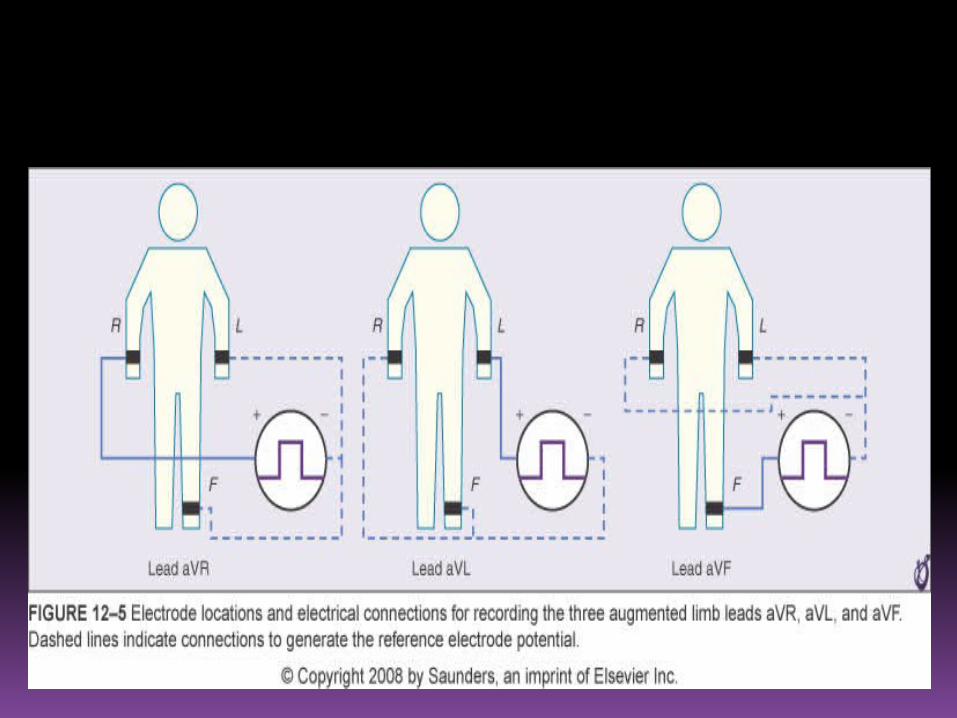
Extremity lead (unipolar)
Menggunakan terminal sentral sebagai titik nol
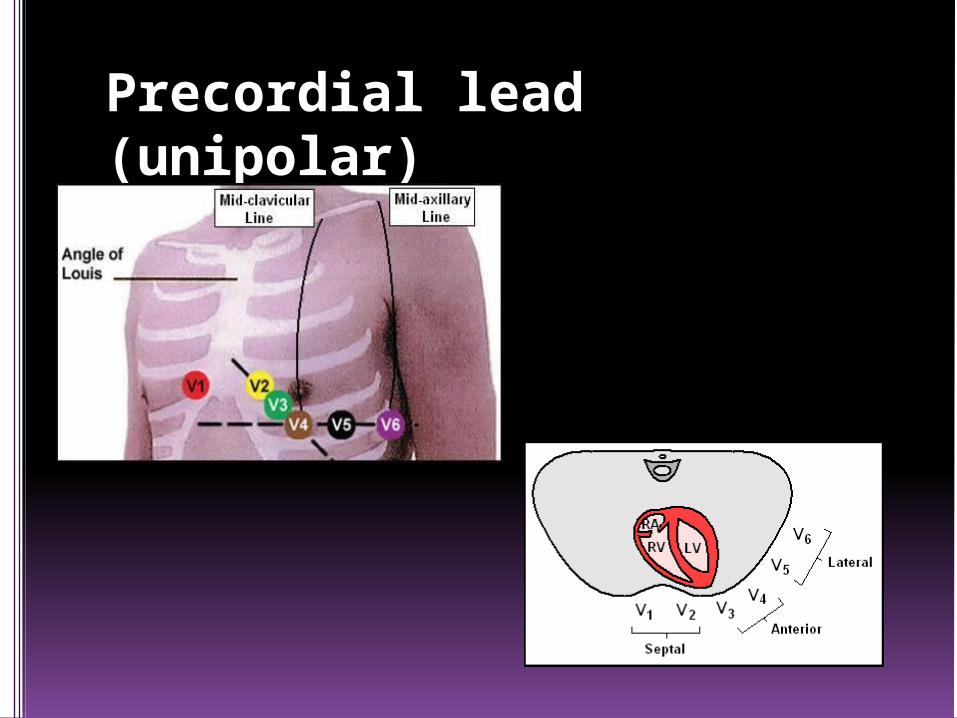
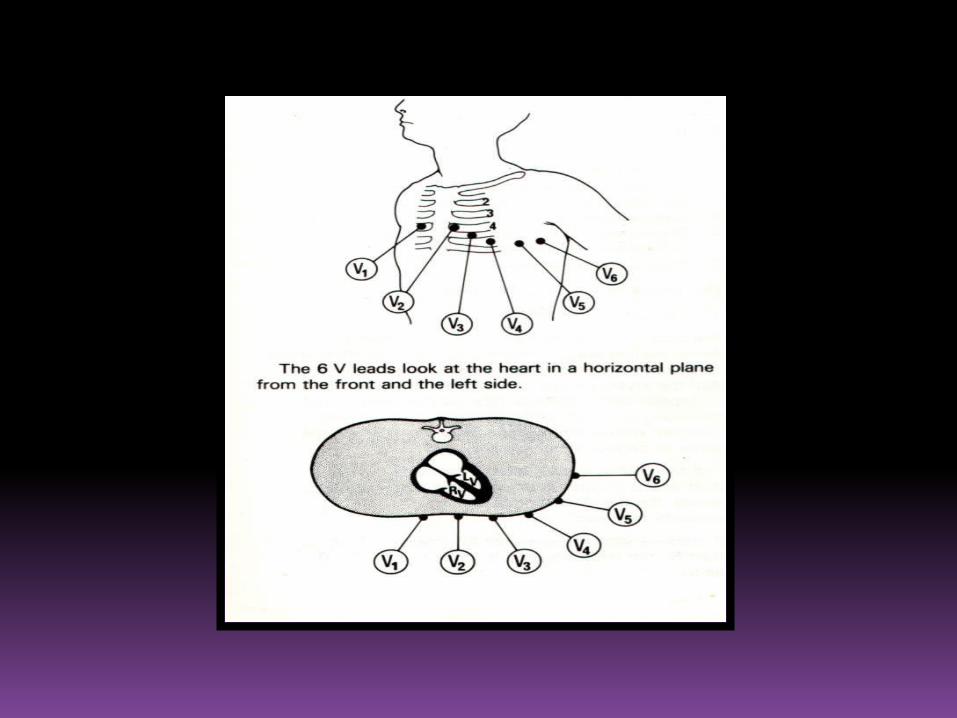
Precordial lead (unipolar)

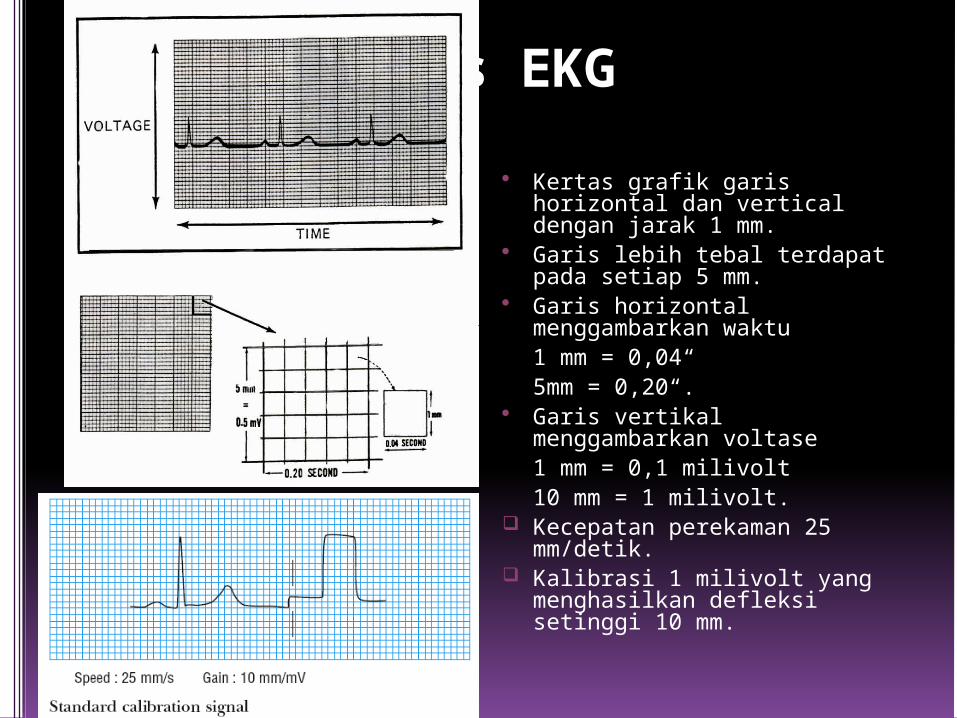
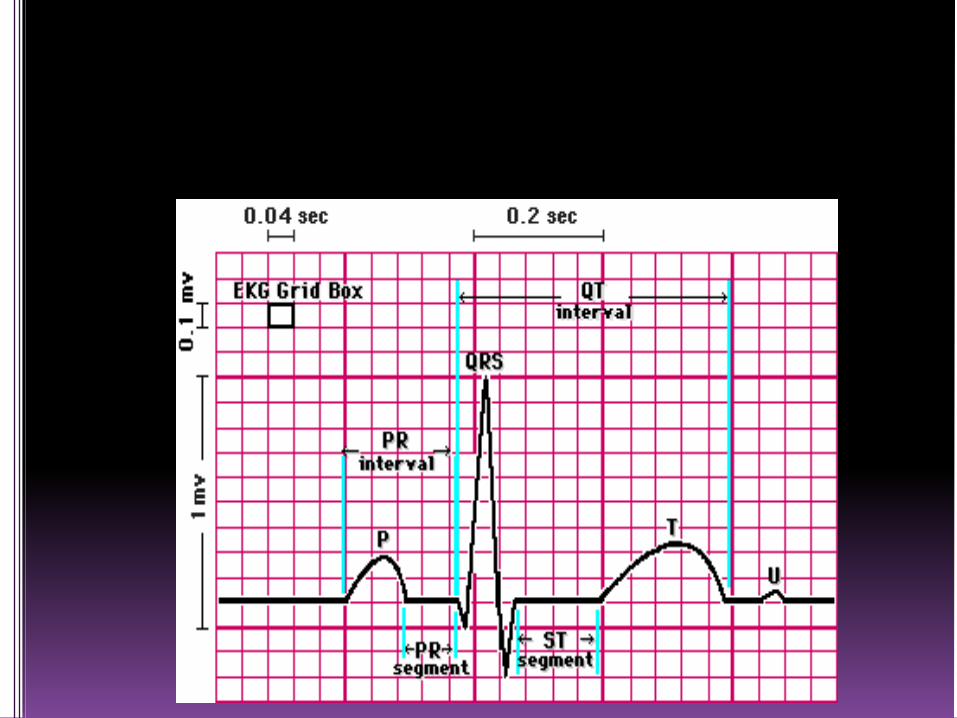
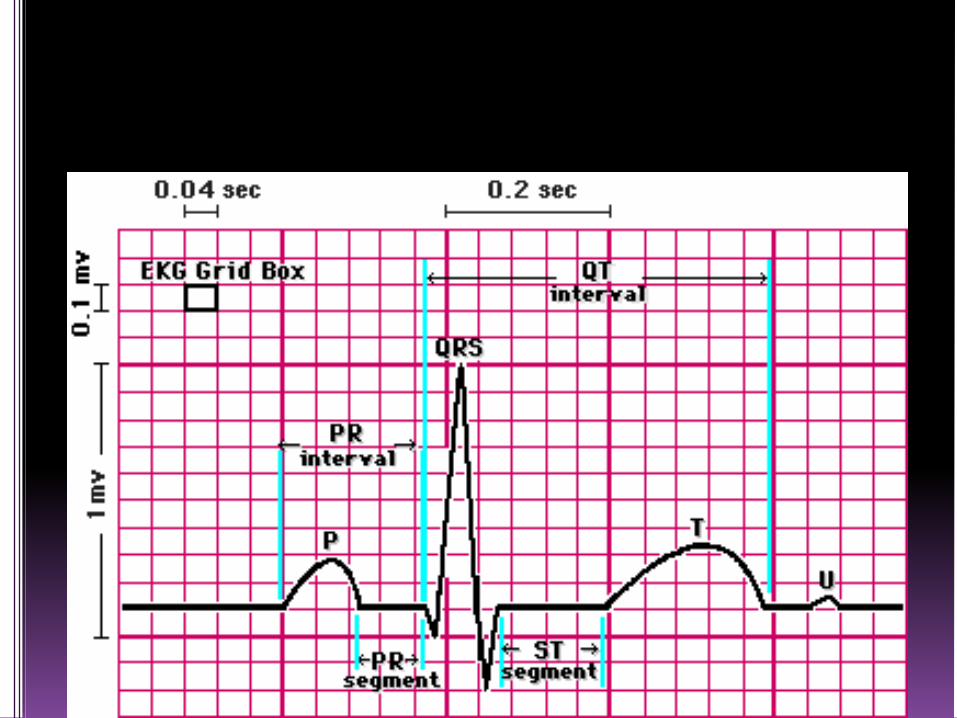
Kertas EKG
Kertas grafik garis horizontal dan vertical dengan jarak 1 mm.
Garis lebih tebal terdapat pada setiap 5 mm.
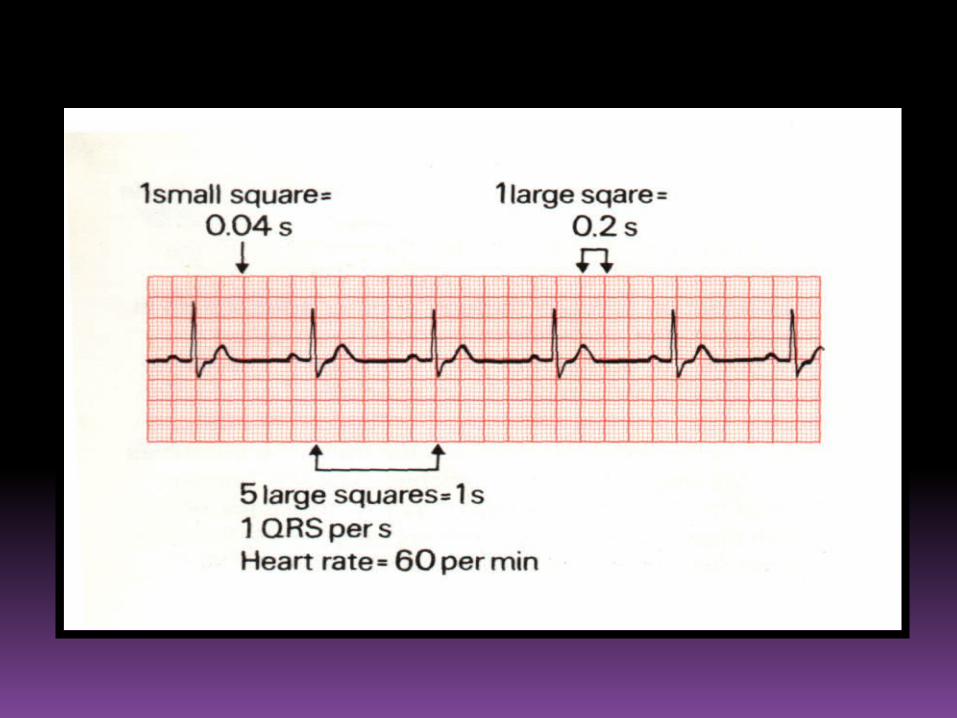
Garis horizontal menggambarkan waktu 1 mm = 0,04“ 5mm = 0,20“.
Garis vertikal menggambarkan voltase 1 mm = 0,1 milivolt10 mm = 1 milivolt.
Kecepatan perekaman 25 mm/detik.
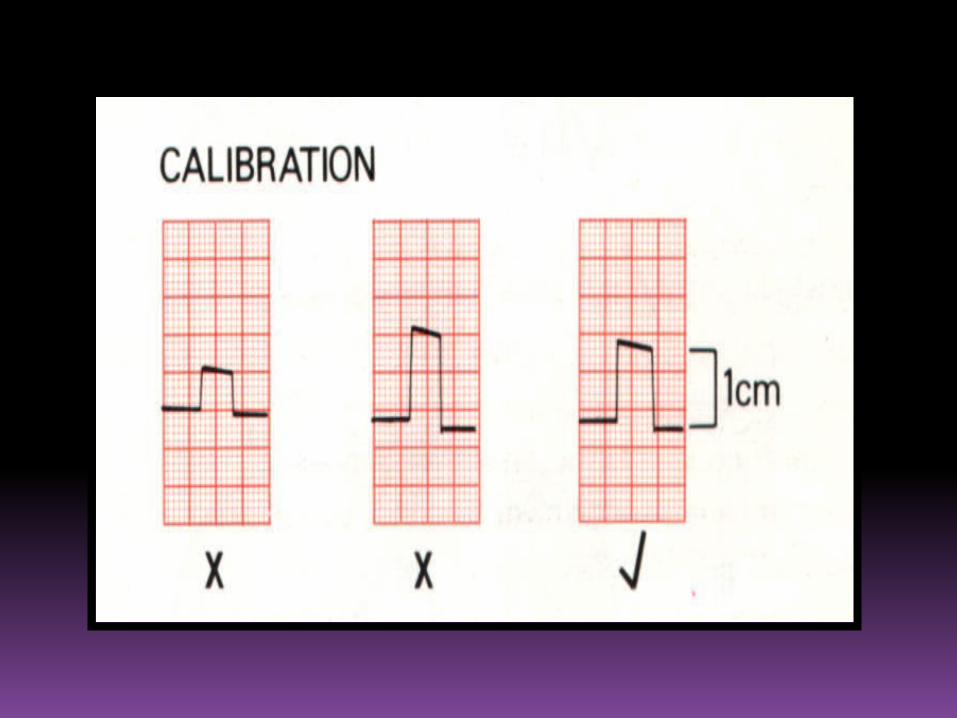
Kalibrasi 1 milivolt yang menghasilkan defleksi setinggi 10 mm.
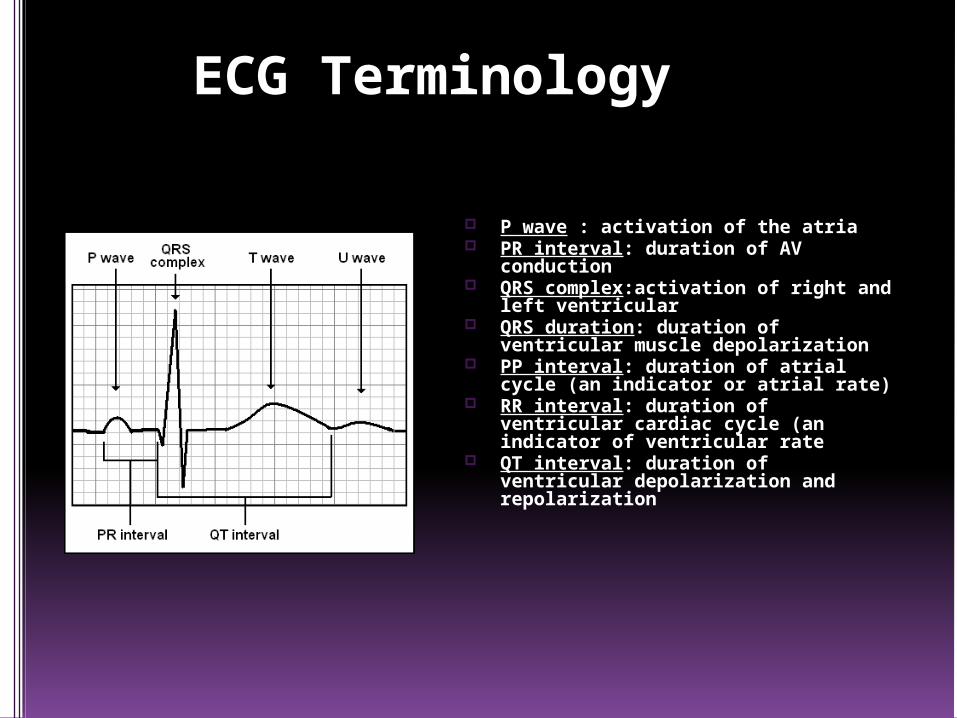
ECG Terminology
P wave : activation of the atria PR interval: duration of AV
conduction QRS complex:activation of right and
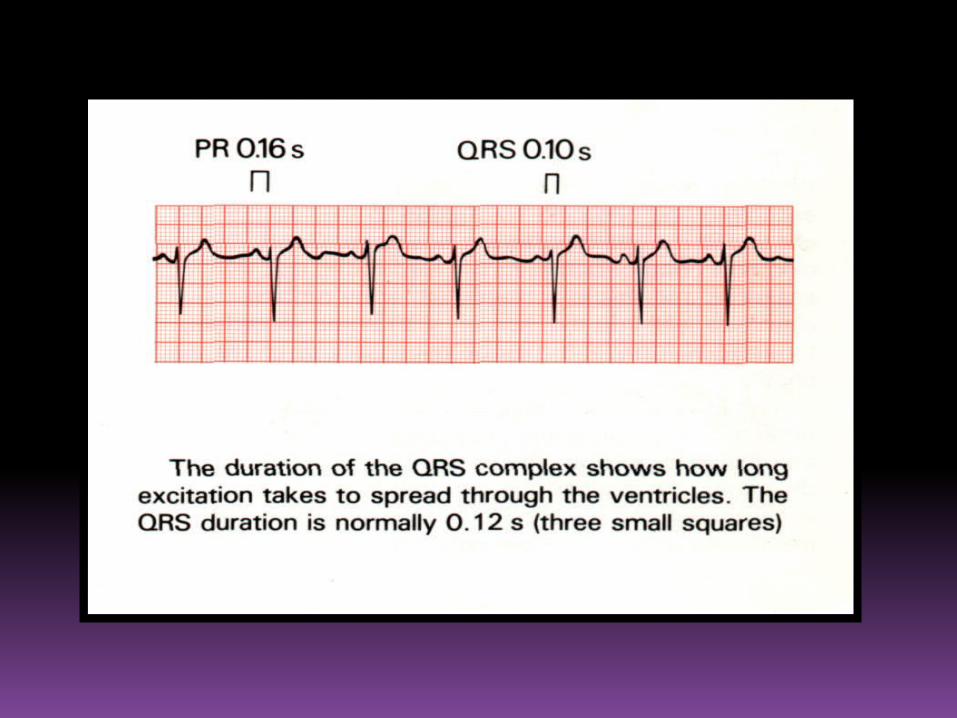
left ventricular QRS duration: duration of
ventricular muscle depolarization PP interval: duration of atrial cycle
(an indicator or atrial rate) RR interval: duration of ventricular
cardiac cycle (an indicator of ventricular rate
QT interval: duration of ventricular depolarization and repolarization

ECG REPORTING
1. Rhythm
2. QRS rate
3. Axis
4. P wave
5. PR interval
6. QRS complex
7. QRS duration
8. ST segment
9. T wave
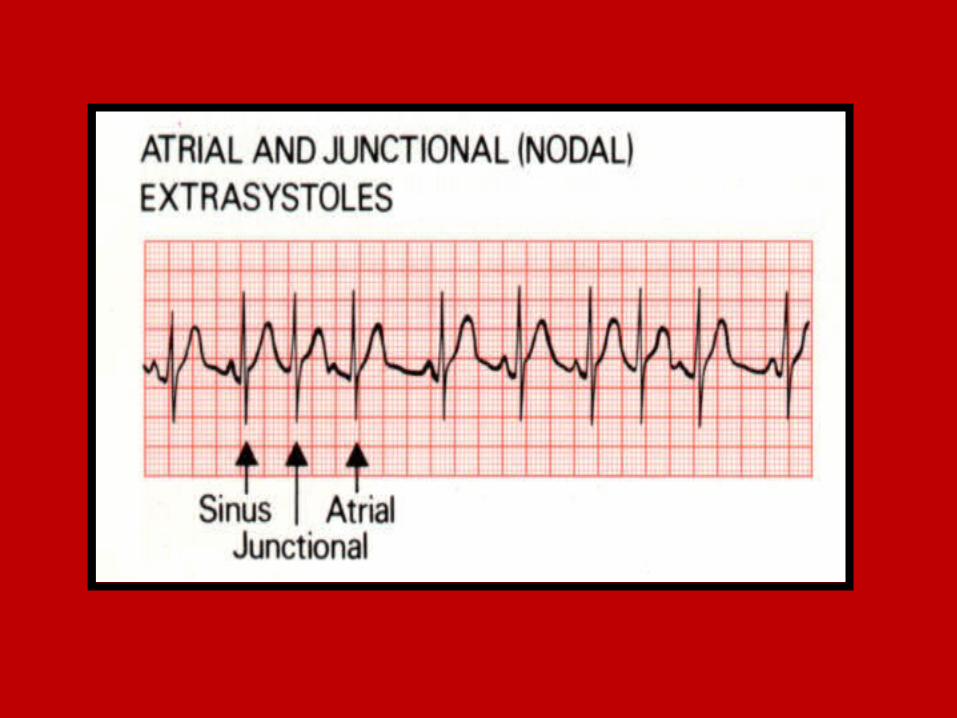
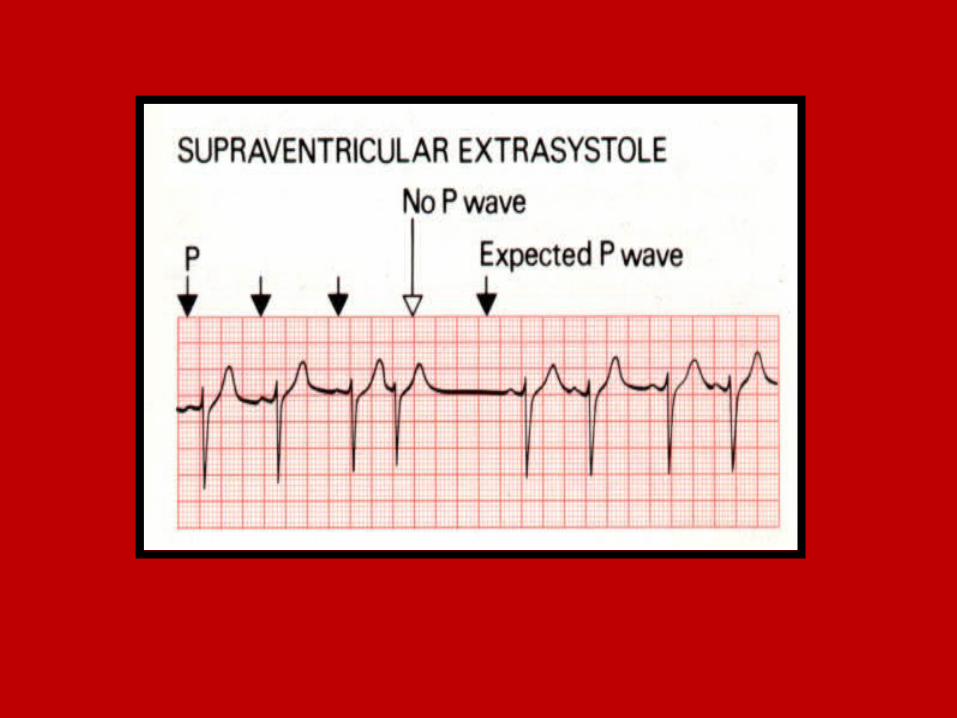
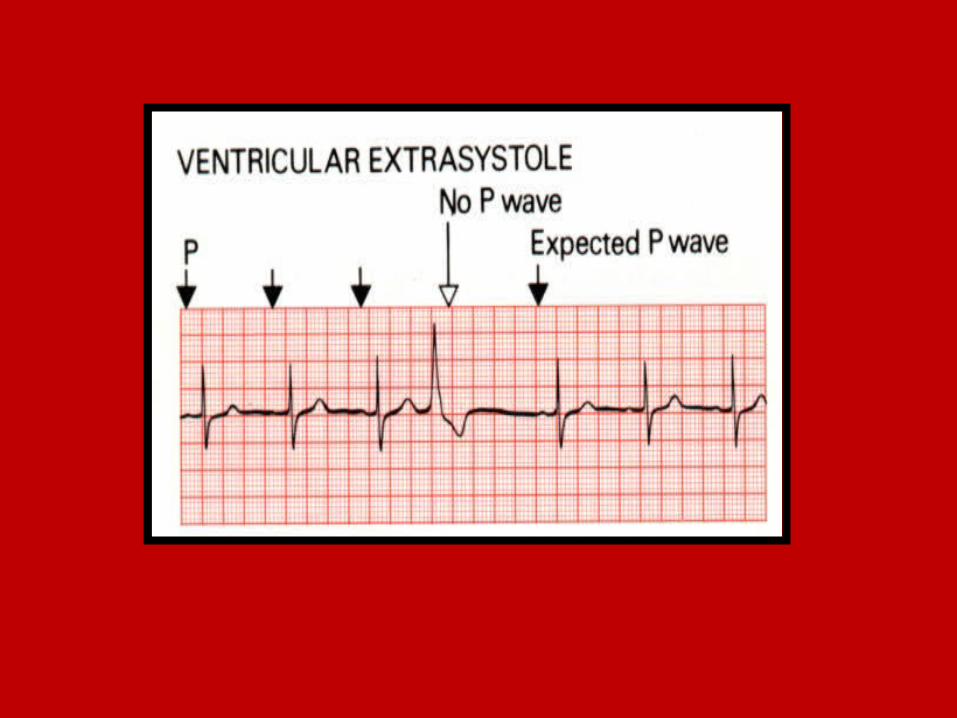
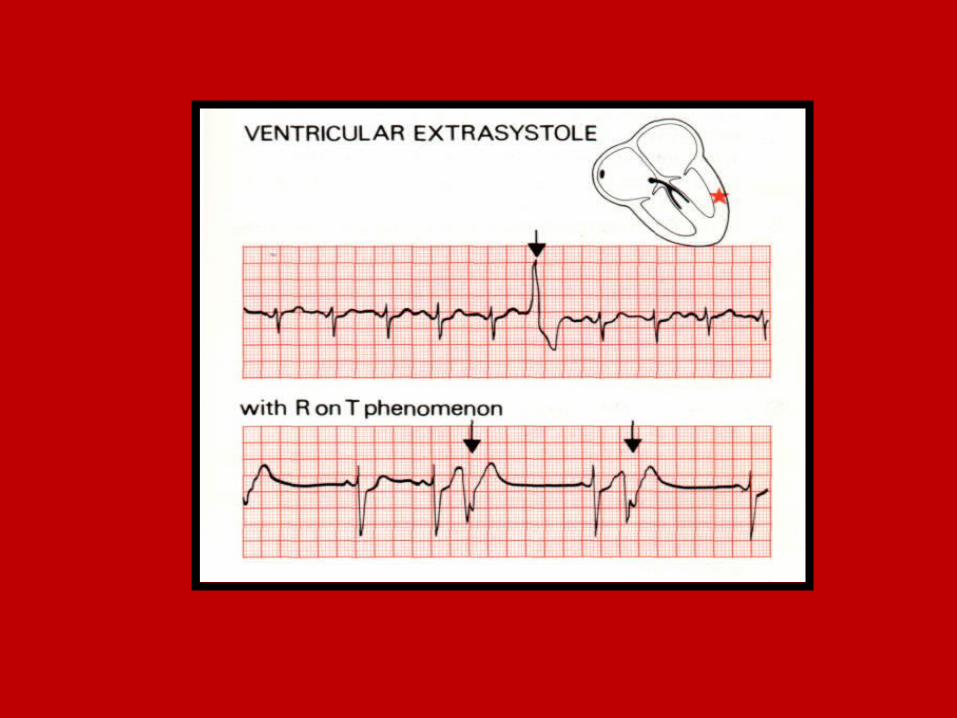
10.Extra systoles
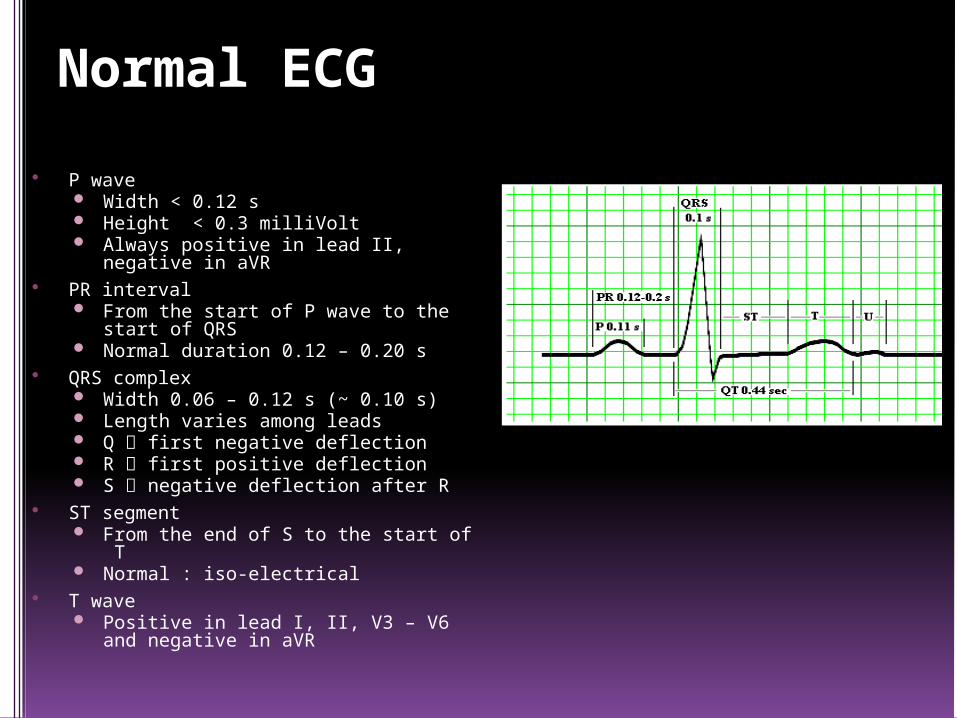
Normal ECG
P wave Width < 0.12 s Height < 0.3 milliVolt Always positive in lead II, negative in
aVR PR interval
From the start of P wave to the start of QRS
Normal duration 0.12 – 0.20 s QRS complex
Width 0.06 – 0.12 s (~ 0.10 s) Length varies among leads Q first negative deflection R first positive deflection S negative deflection after R
ST segment From the end of S to the start of T Normal : iso-electrical
T wave Positive in lead I, II, V3 – V6 and
negative in aVR
ECG REPORTING
1. Rhythm
2. QRS rate
3. Axis
4. P wave
5. PR interval
6. QRS complex
7. QRS duration
8. ST segment
9. T wave
10.Extra systoles
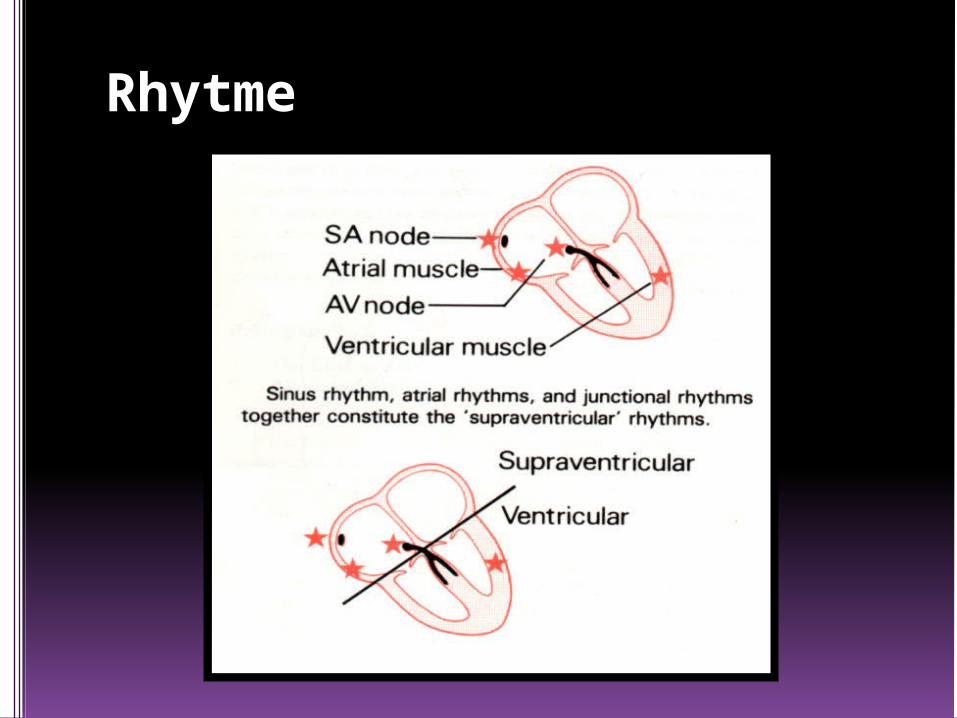
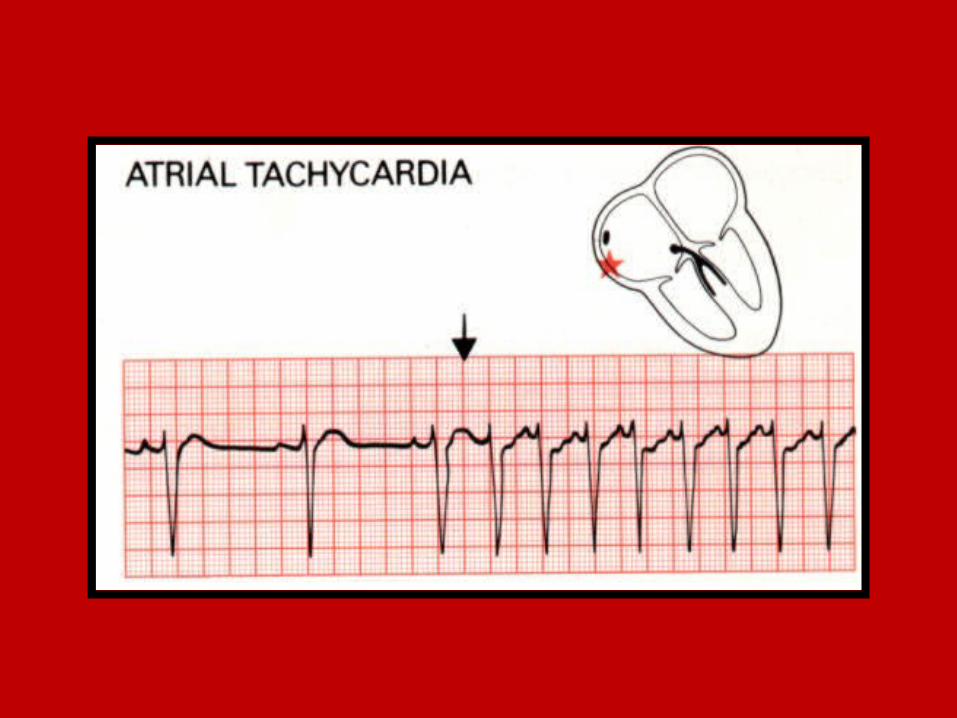
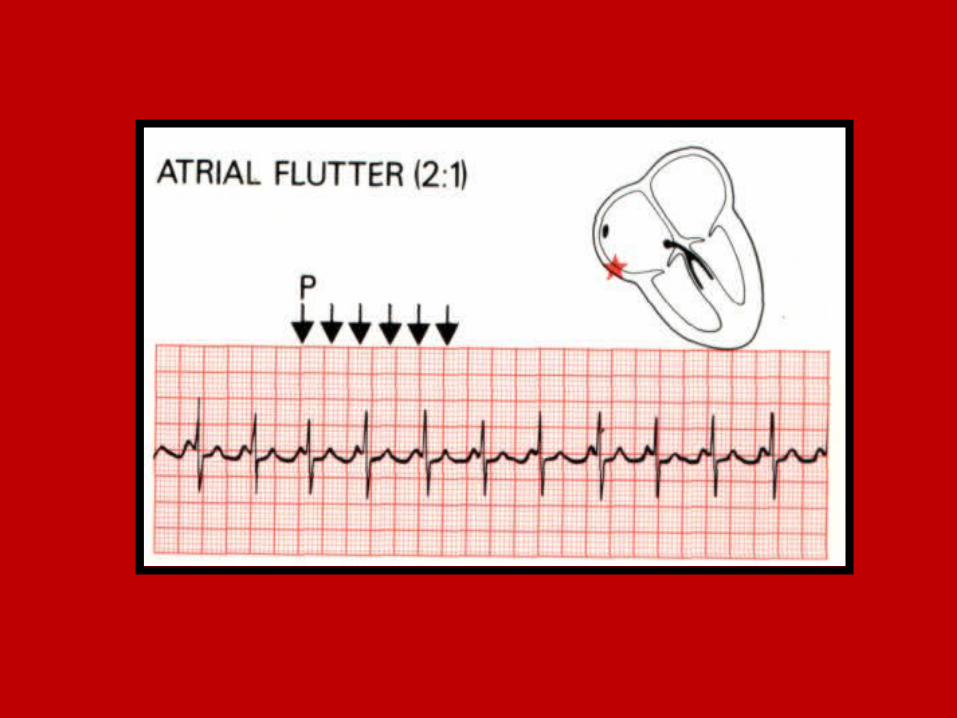
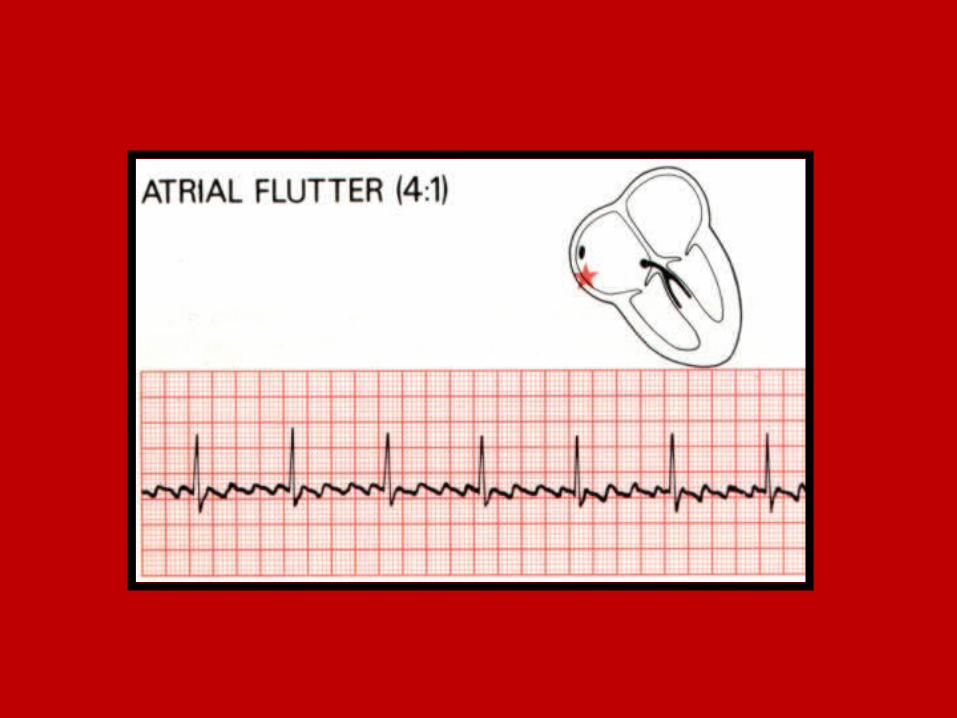
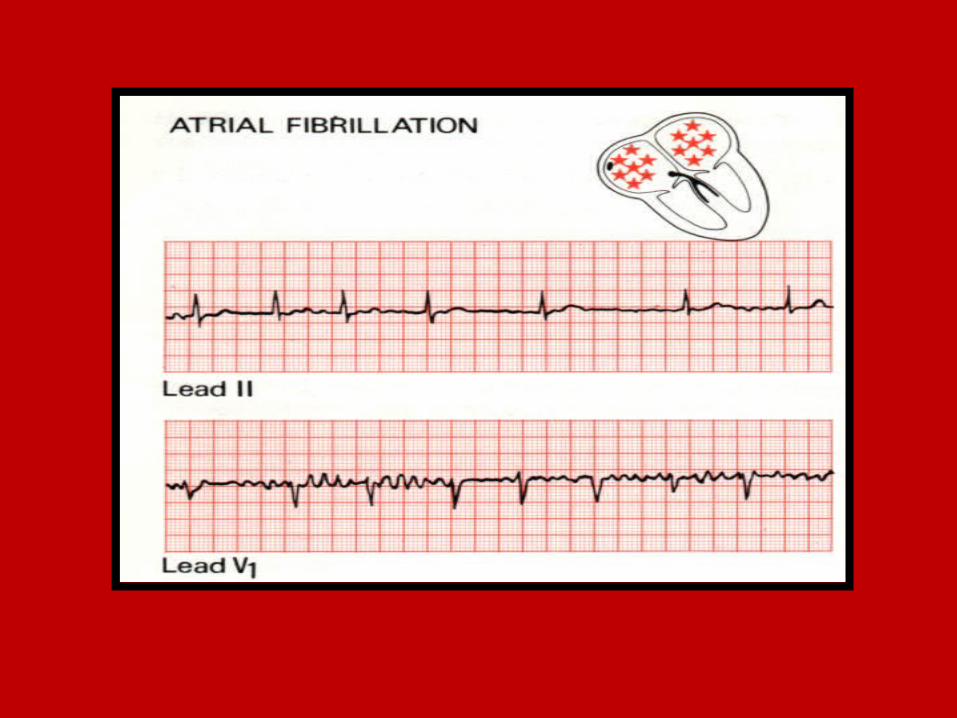
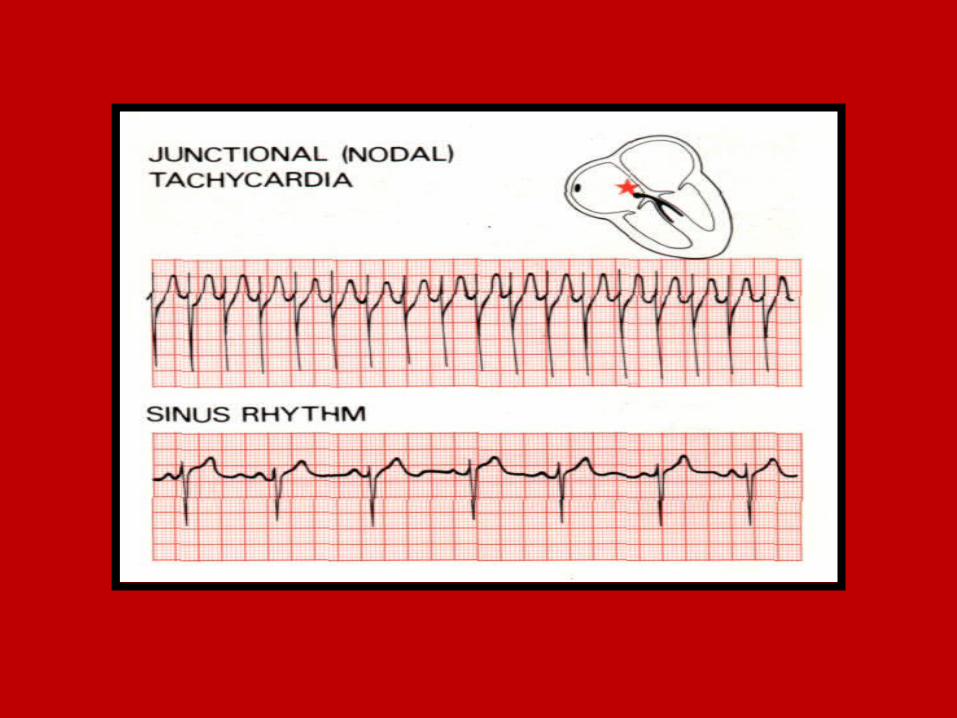
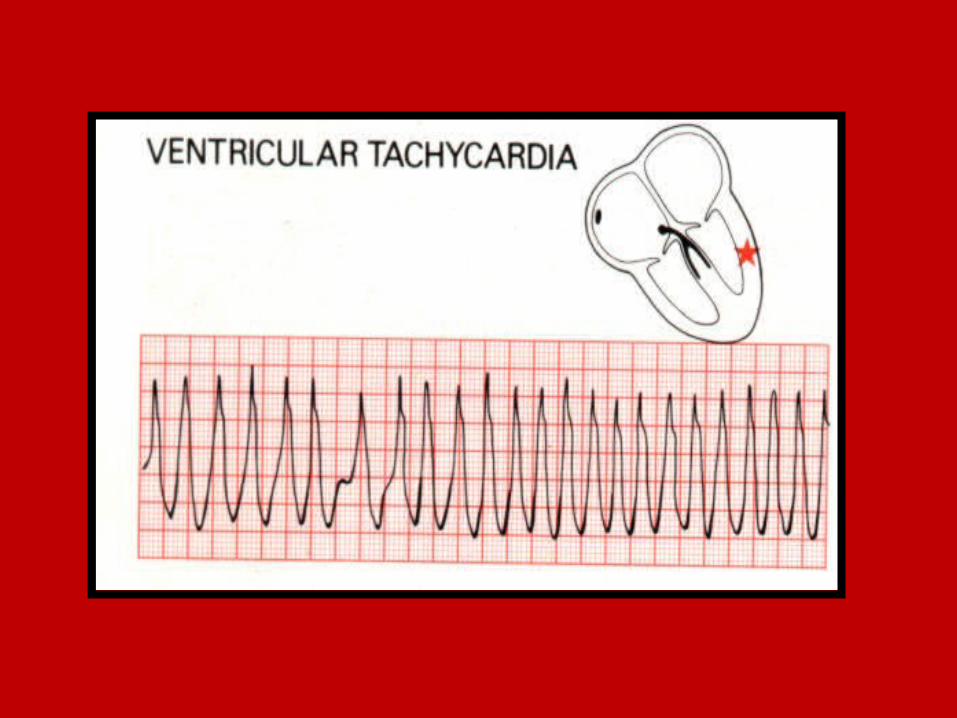
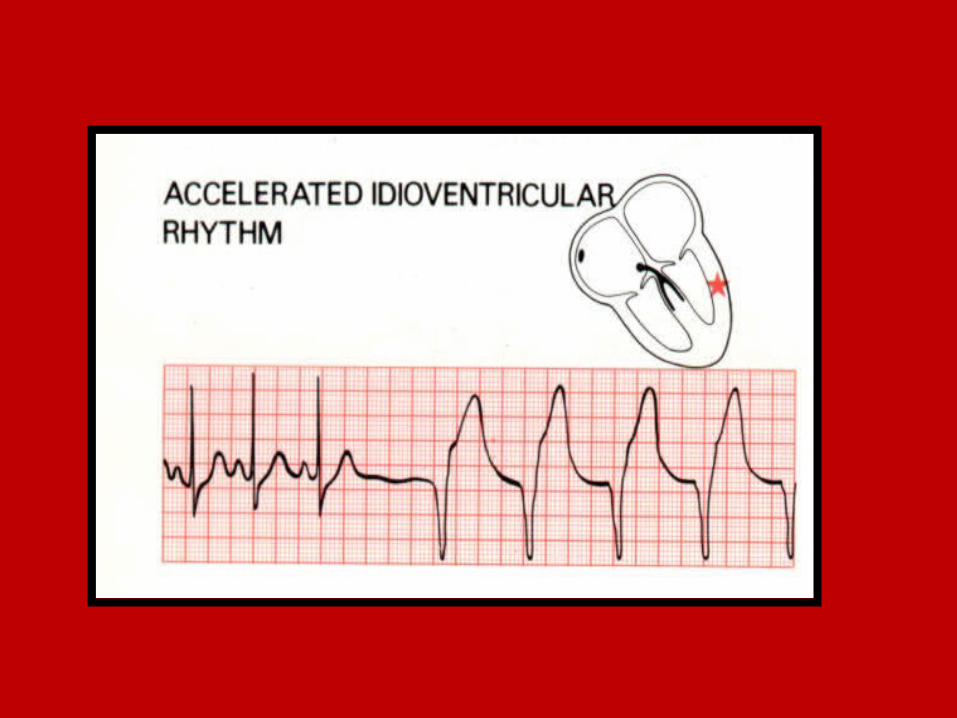
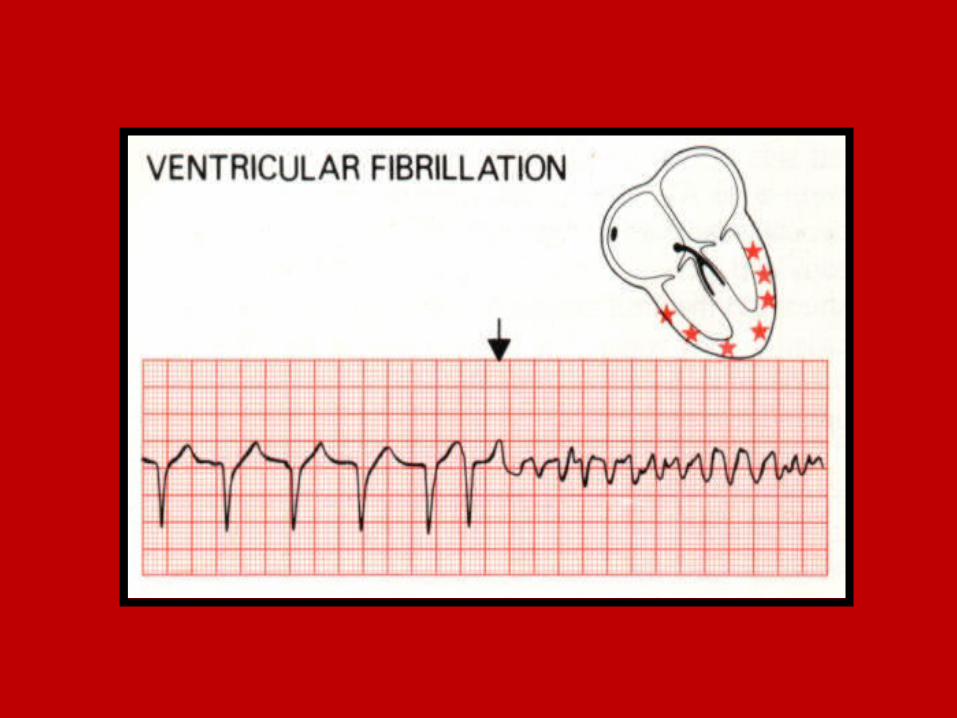
Rhytme
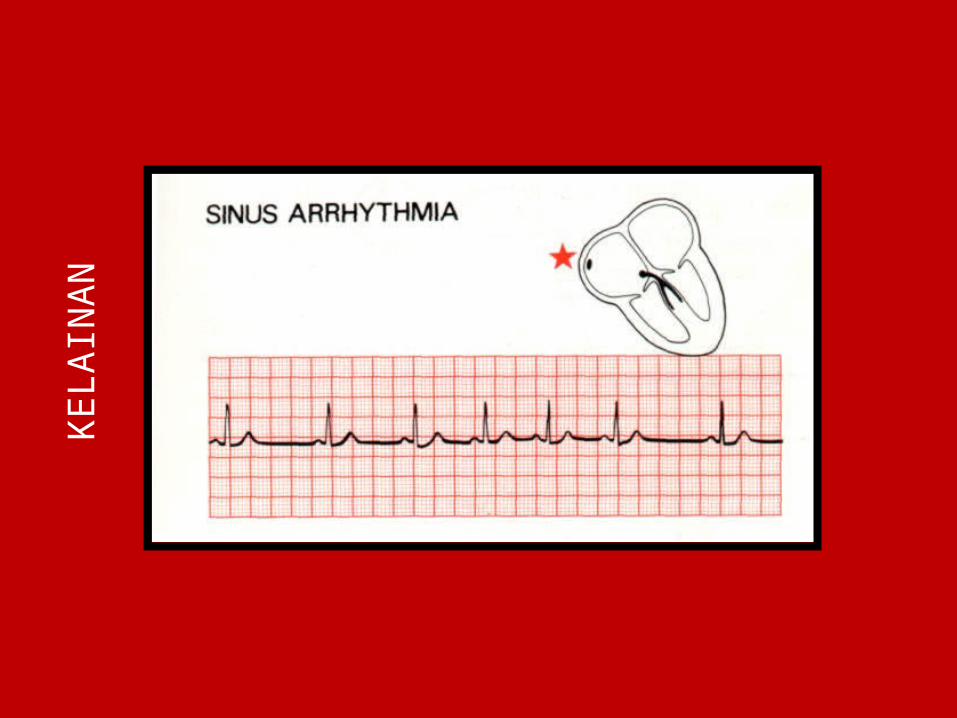
KELA
INA
N

ECG REPORTING
1. Rhythm
2. QRS rate
3. Axis
4. P wave
5. PR interval
6. QRS complex
7. QRS duration
8. ST segment
9. T wave
10.Extra systoles
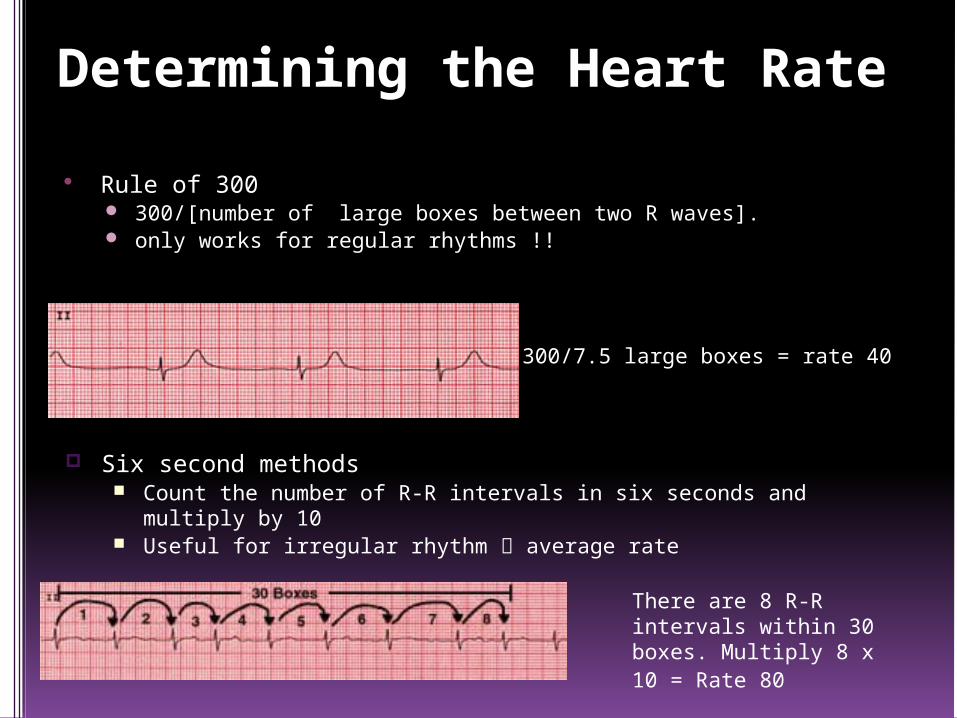
Determining the Heart Rate
Rule of 300 300/[number of large boxes between two R waves]. only works for regular rhythms !!
300/7.5 large boxes = rate 40
Six second methods Count the number of R-R intervals in six seconds and multiply by 10 Useful for irregular rhythm average rate
There are 8 R-R intervals within 30 boxes. Multiply 8 x 10 = Rate 80

ECG REPORTING
1. Rhythm
2. QRS rate
3. Axis
4. P wave
5. PR interval
6. QRS complex
7. QRS duration
8. ST segment
9. T wave
10.Extra systoles
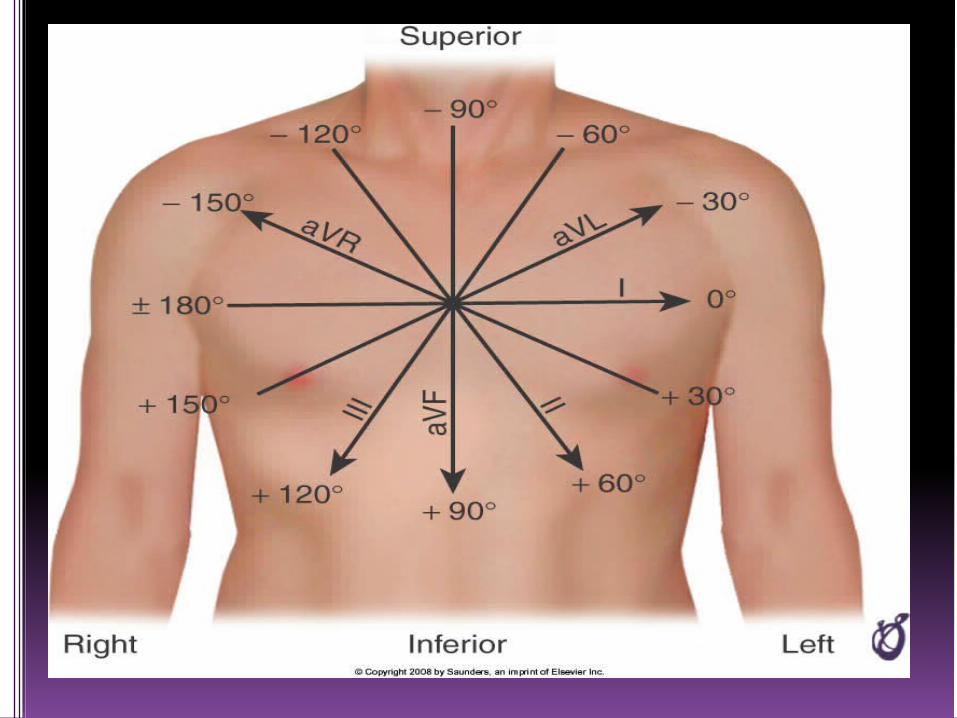
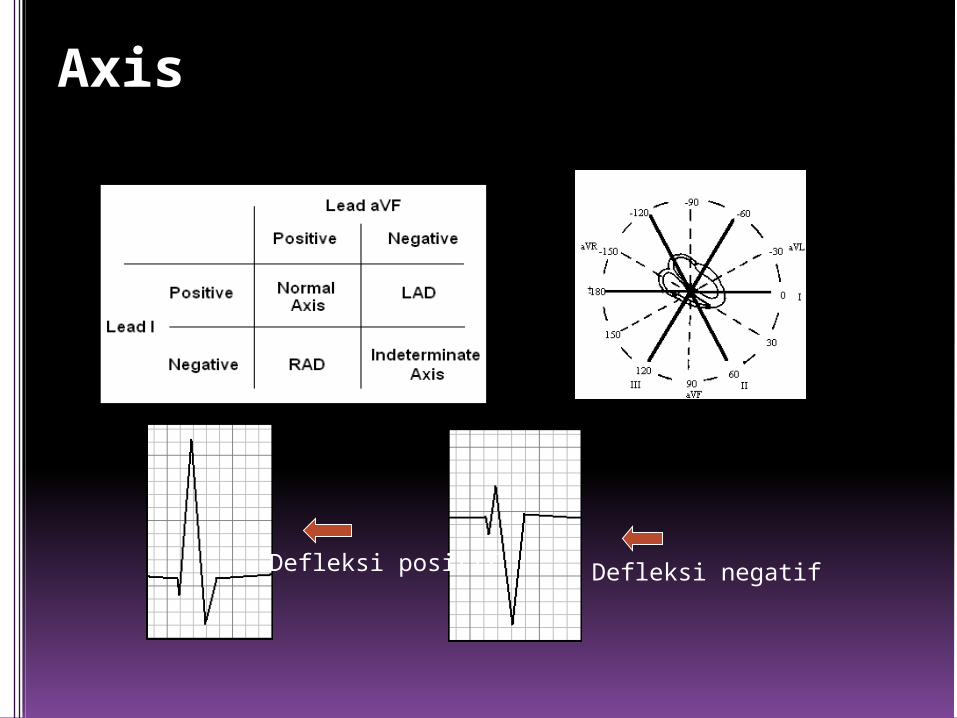
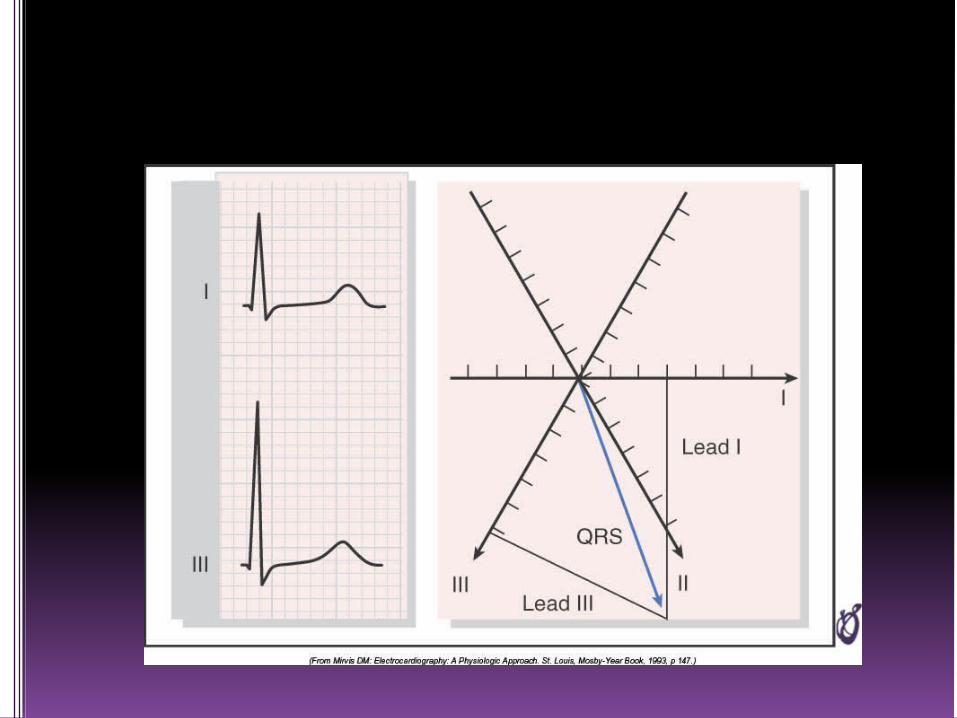
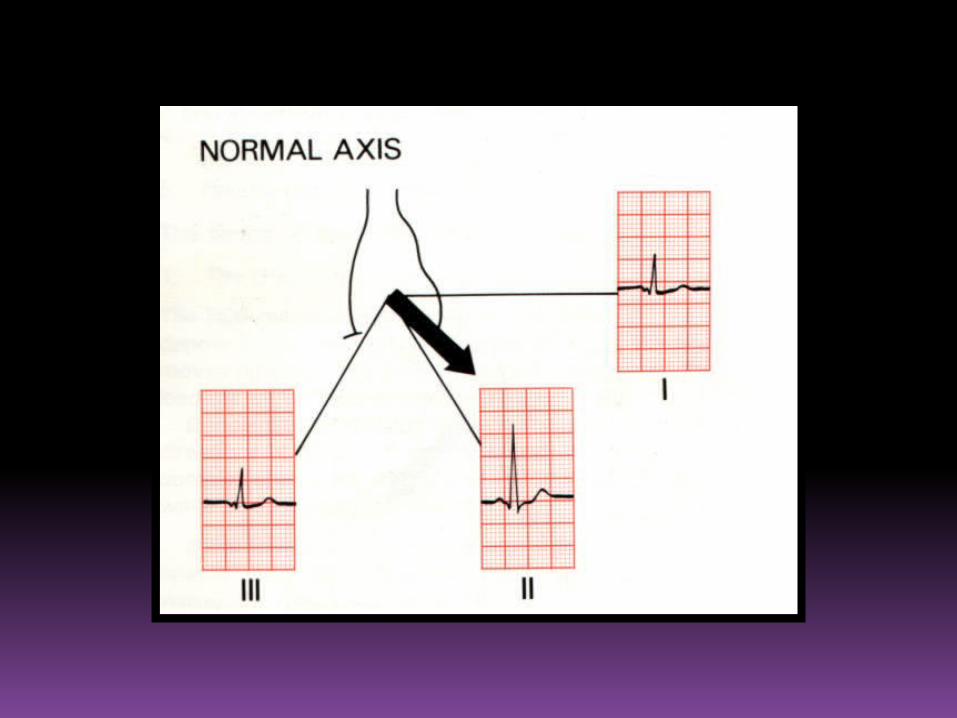
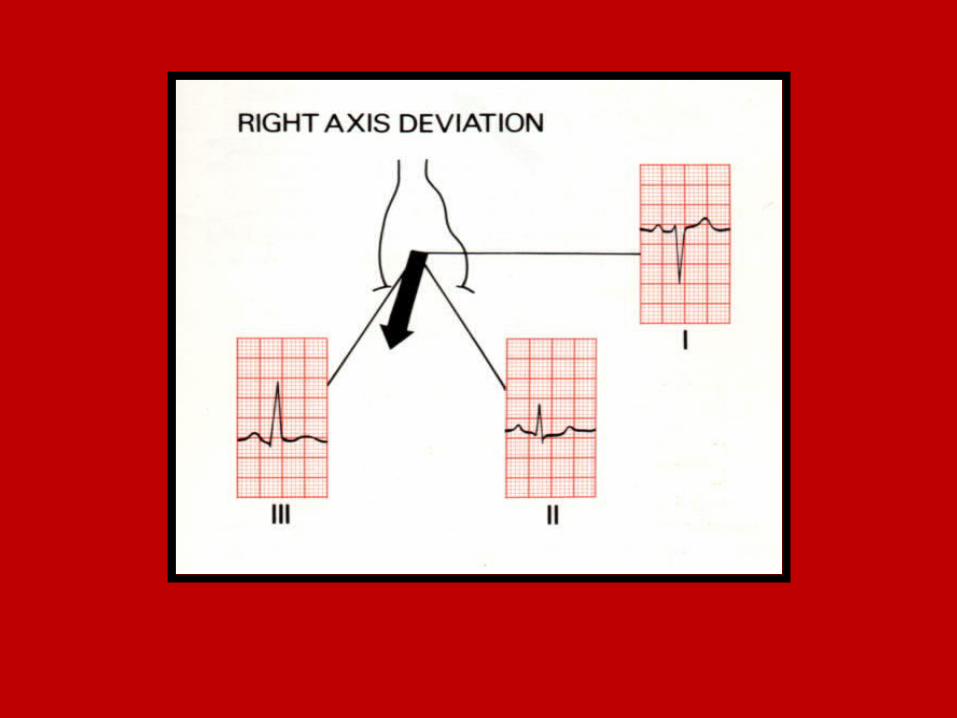
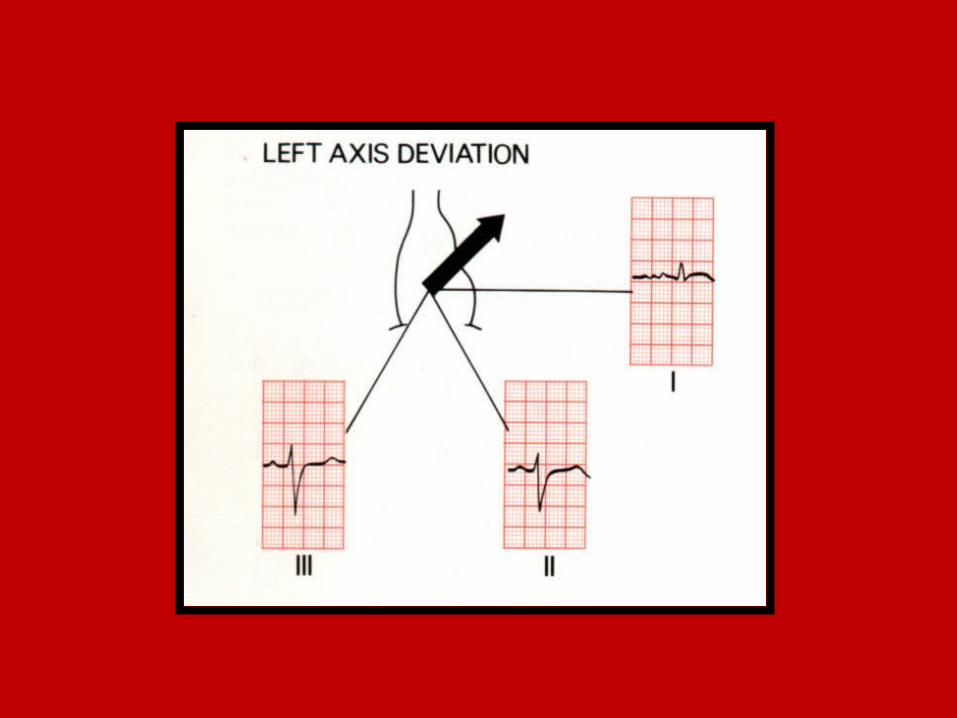
Axis
Defleksi positif Defleksi negatif
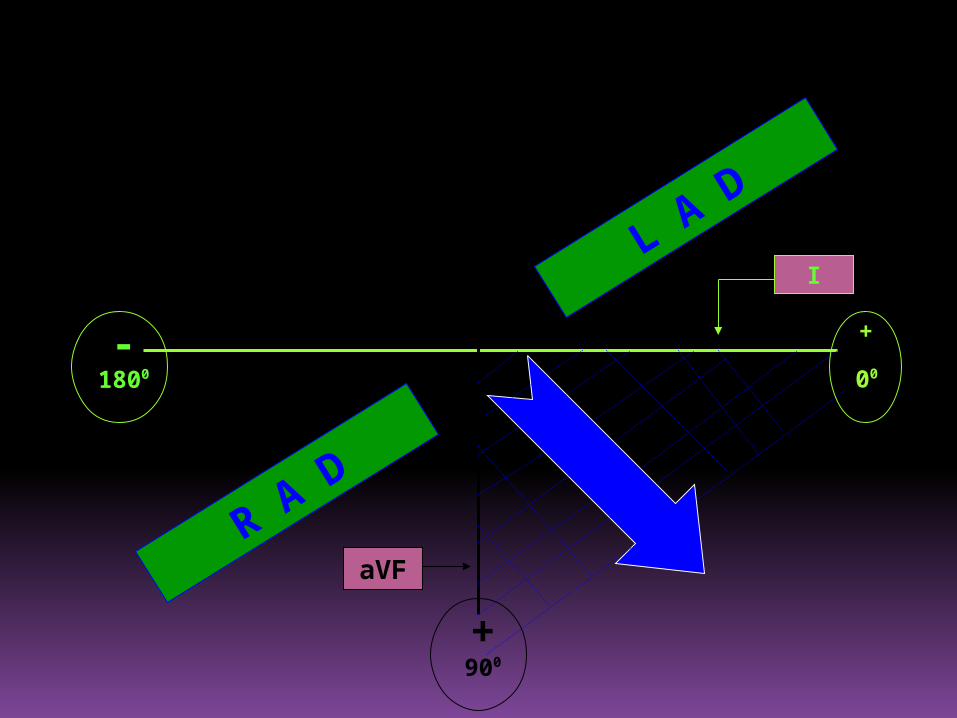
aVF
—
3600
-1800
I
+900
+
00
R A D
L A D

ECG REPORTING
1. Rhythm
2. QRS rate
3. Axis
4. P wave
5. PR interval
6. QRS complex
7. QRS duration
8. ST segment
9. T wave
10.Extra systoles
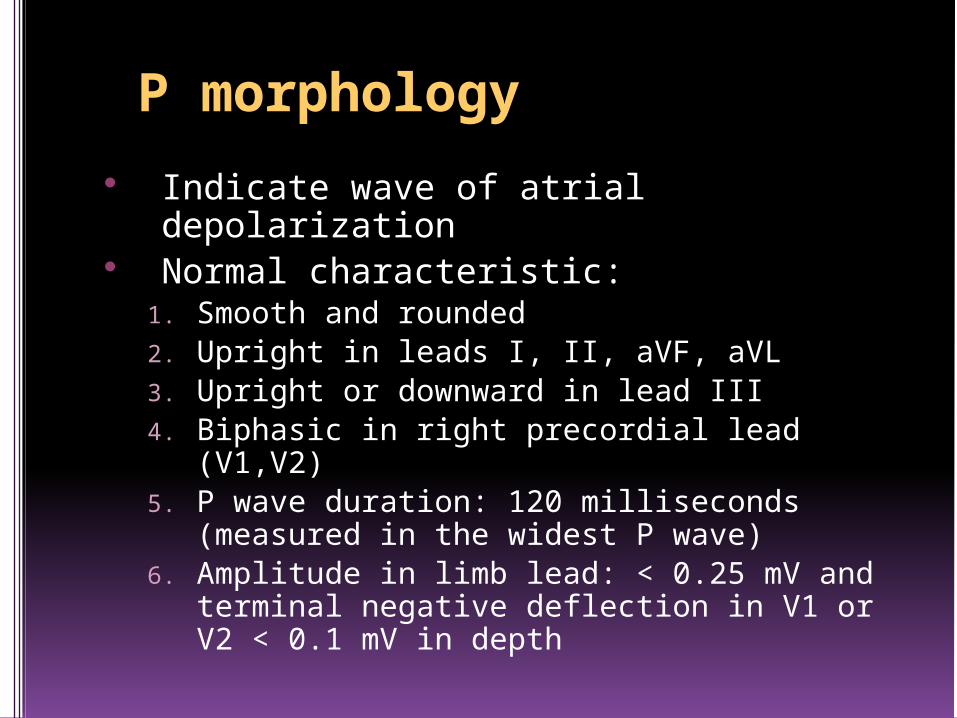
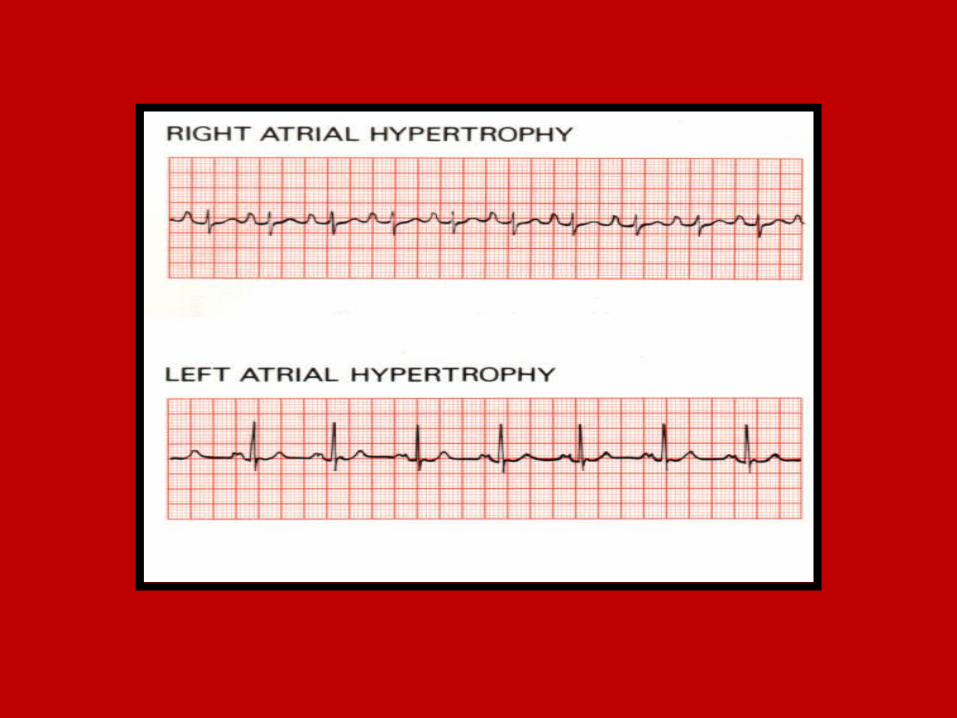
P morphology
Indicate wave of atrial depolarization Normal characteristic:
1. Smooth and rounded2. Upright in leads I, II, aVF, aVL3. Upright or downward in lead III4. Biphasic in right precordial lead (V1,V2)5. P wave duration: 120 milliseconds
(measured in the widest P wave)6. Amplitude in limb lead: < 0.25 mV and
terminal negative deflection in V1 or V2 < 0.1 mV in depth
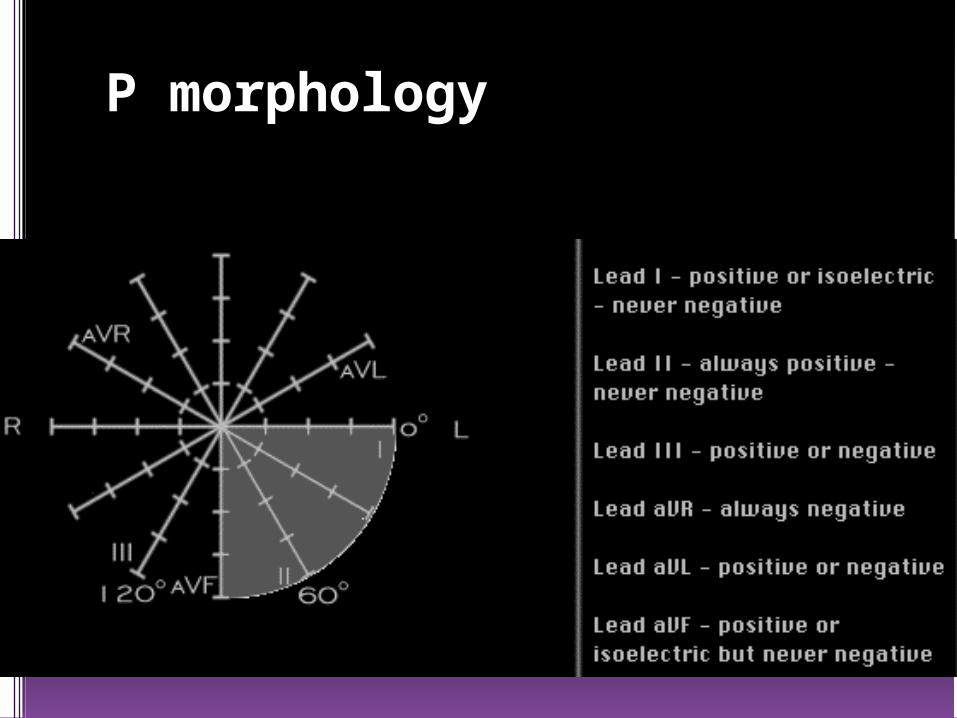
P morphology

ECG REPORTING
1. Rhythm
2. QRS rate
3. Axis
4. P wave
5. PR interval
6. QRS complex
7. QRS duration
8. ST segment
9. T wave
10.Extra systoles
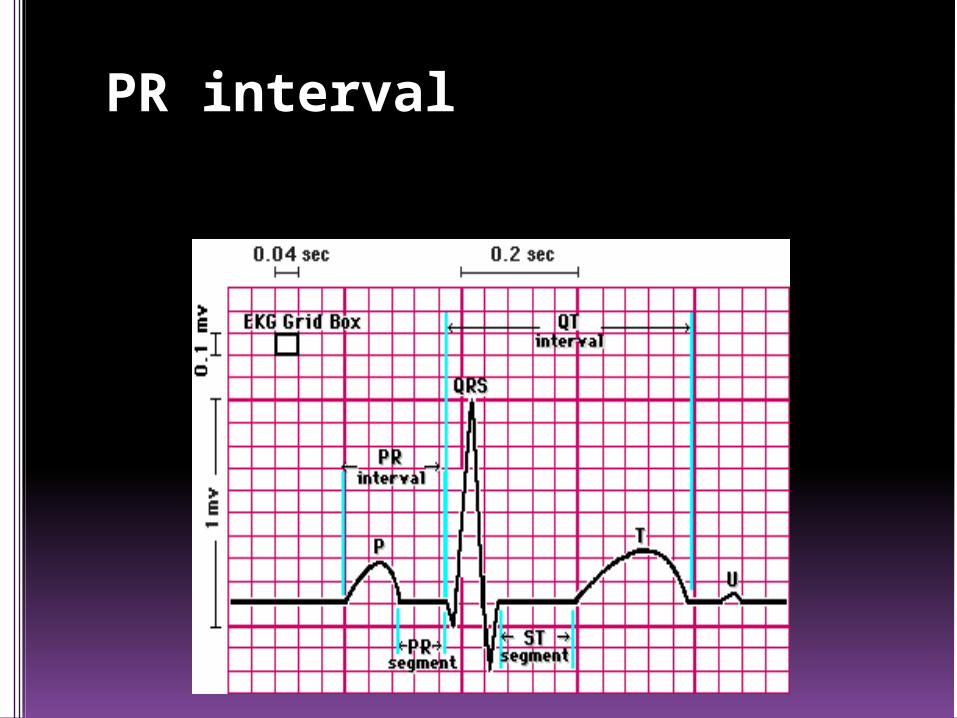
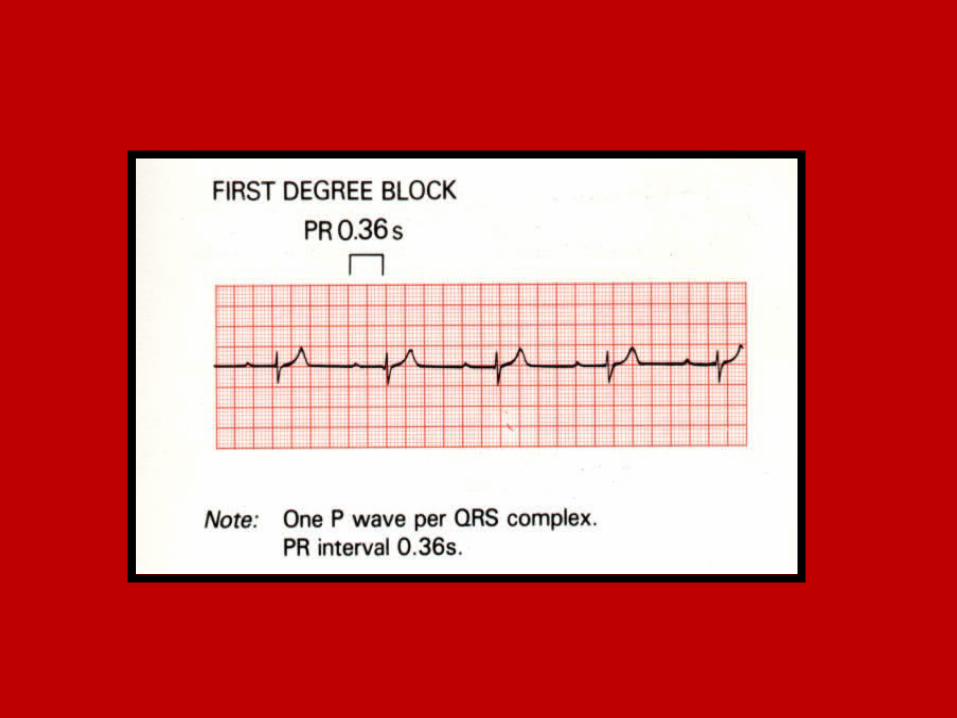
PR interval
Mulai dari awal gelombang P sampai dengan permulaan kompleks QRS
Durassi normal 0.12-0.2 detik
PR interval

ECG REPORTING
1. Rhythm
2. QRS rate
3. Axis
4. P wave
5. PR interval
6. QRS complex
7. QRS duration
8. ST segment
9. T wave
10.Extra systoles
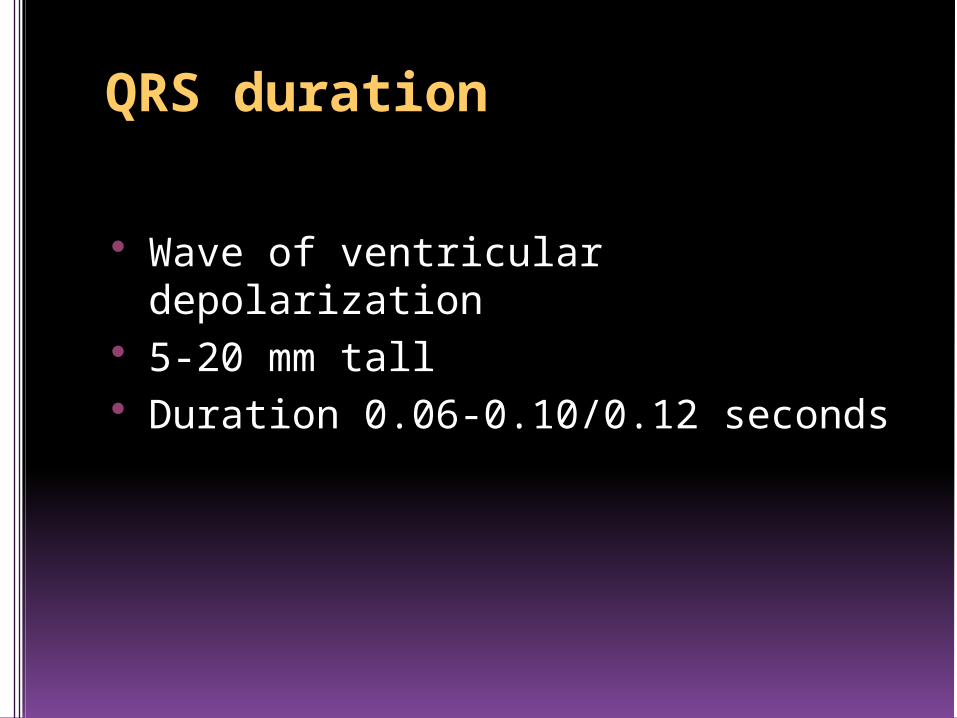
QRS duration
Wave of ventricular depolarization 5-20 mm tall Duration 0.06-0.10/0.12 seconds
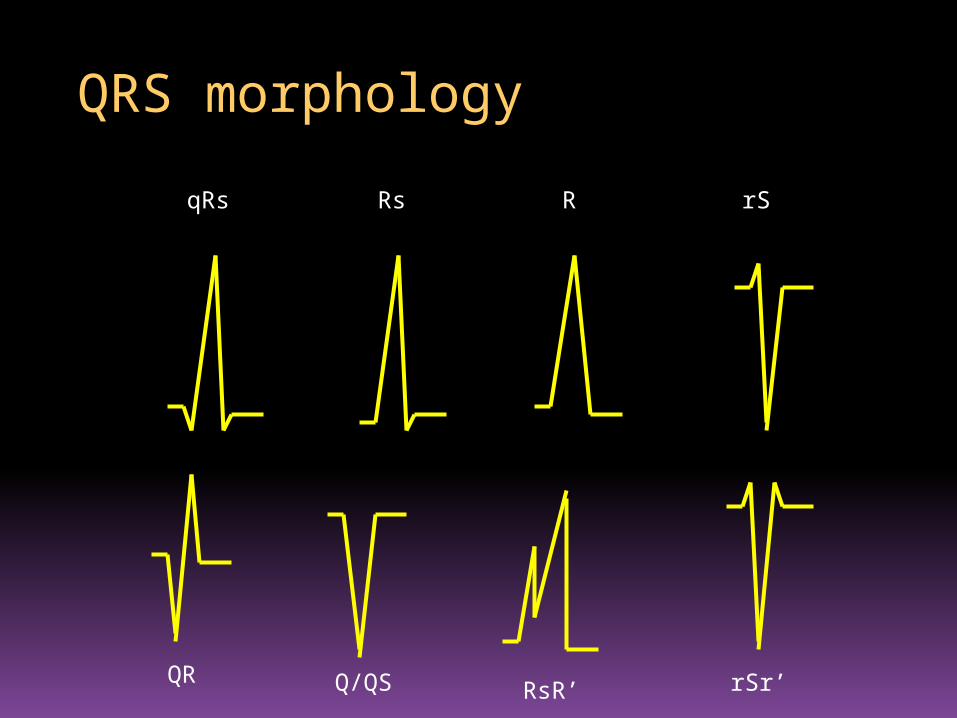
QRS morphology
qRs Rs R rS
QR Q/QS RsR’ rSr’
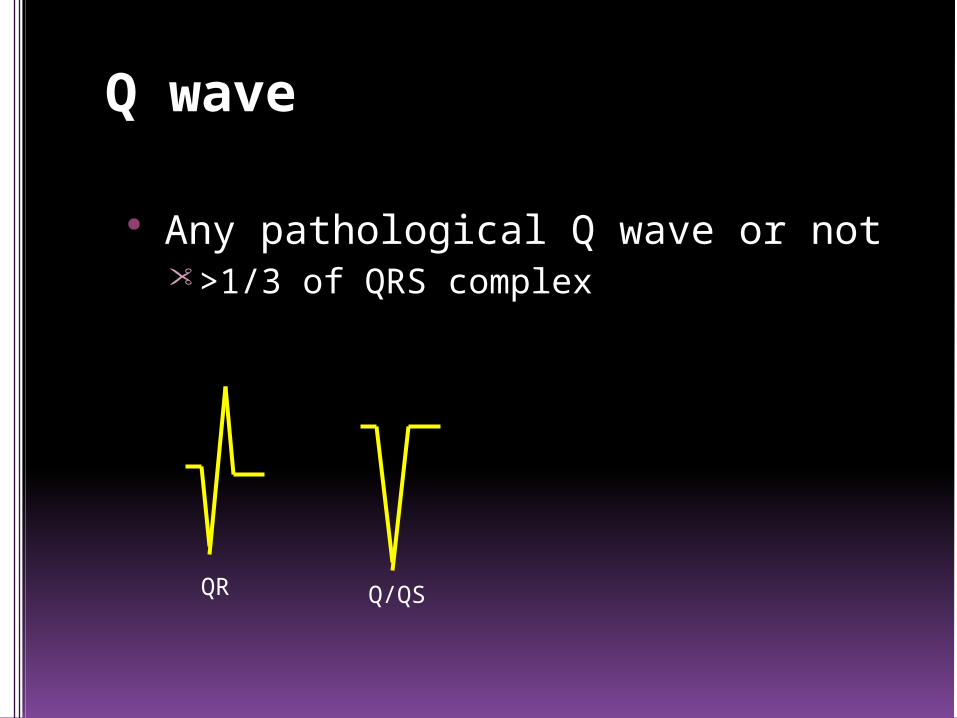
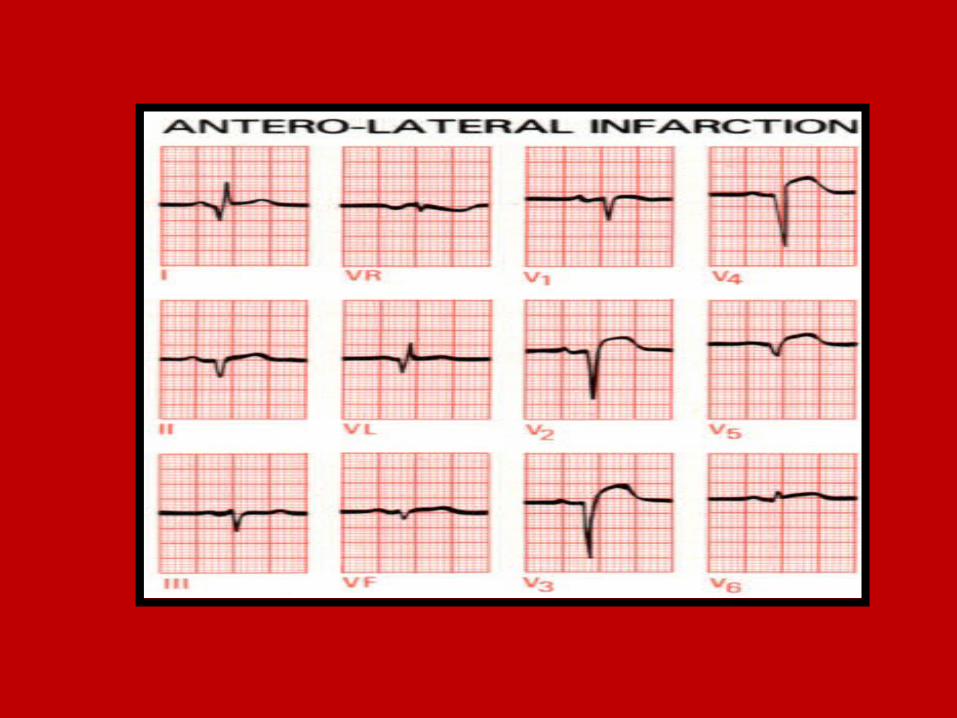
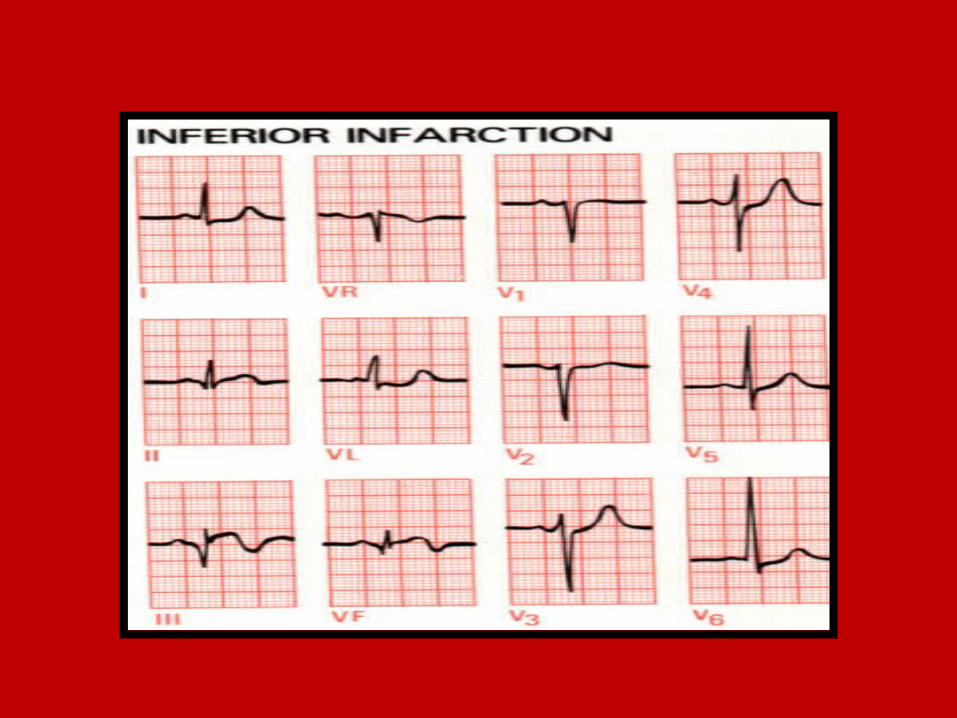
Q wave
Any pathological Q wave or not• >1/3 of QRS complex
QR Q/QS
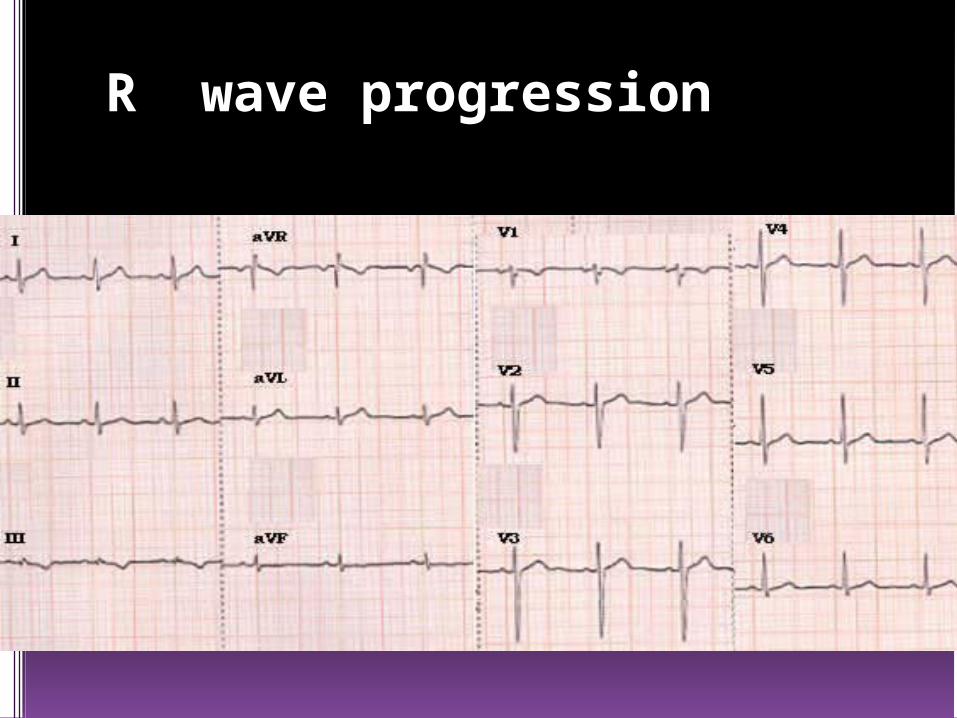
R wave progression

ECG REPORTING
1. Rhythm
2. QRS rate
3. Axis
4. P wave
5. PR interval
6. QRS complex
7. QRS duration
8. ST segment
9. T wave
10.Extra systoles
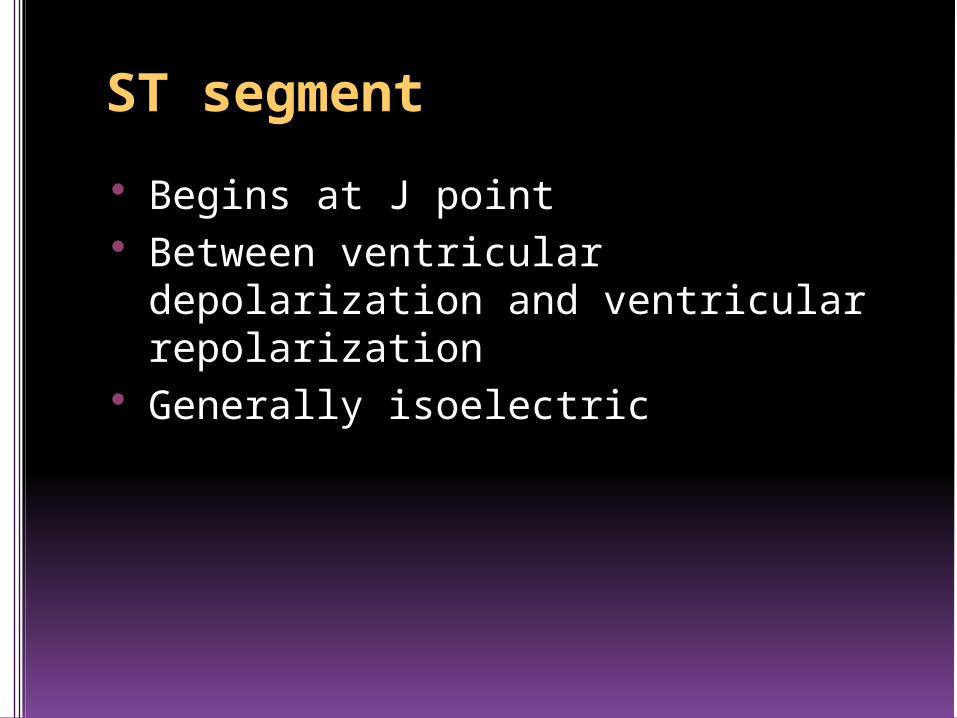
ST segment
Begins at J point Between ventricular depolarization
and ventricular repolarization Generally isoelectric
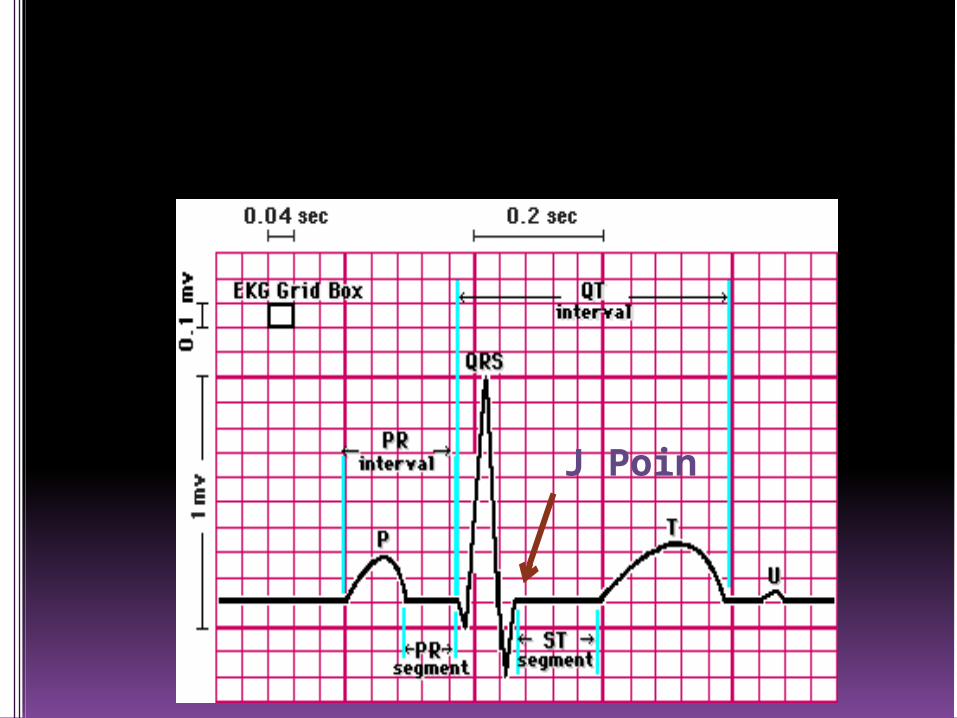
J Poin
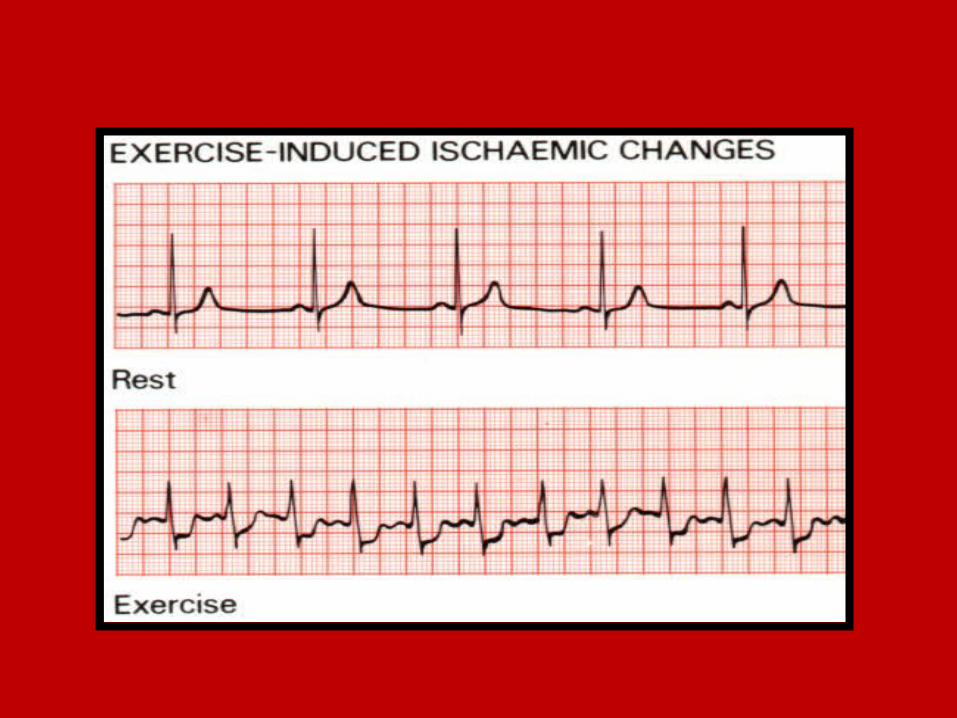
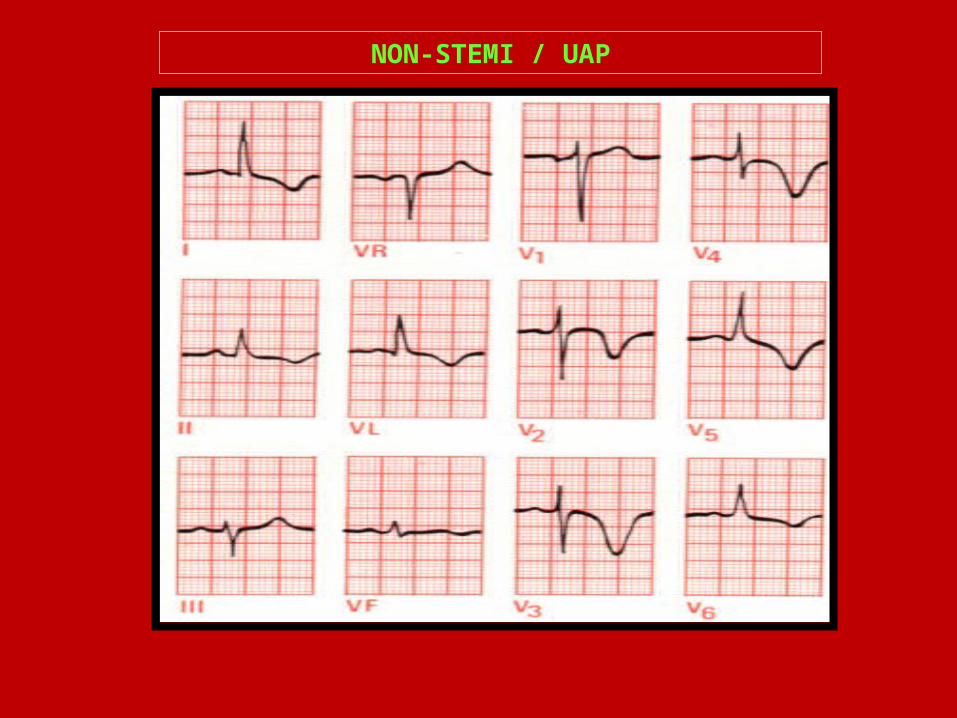
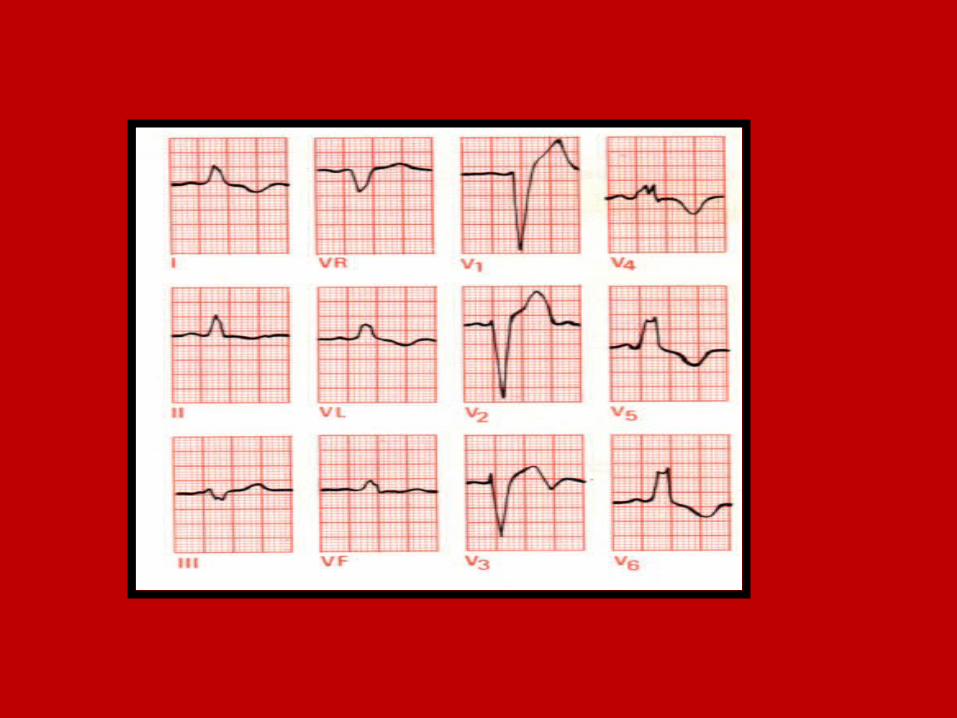
NON-STEMI / UAP

ECG REPORTING
1. Rhythm
2. QRS rate
3. Axis
4. P wave
5. PR interval
6. QRS complex
7. QRS duration
8. ST segment
9. T wave
10.Extra systoles
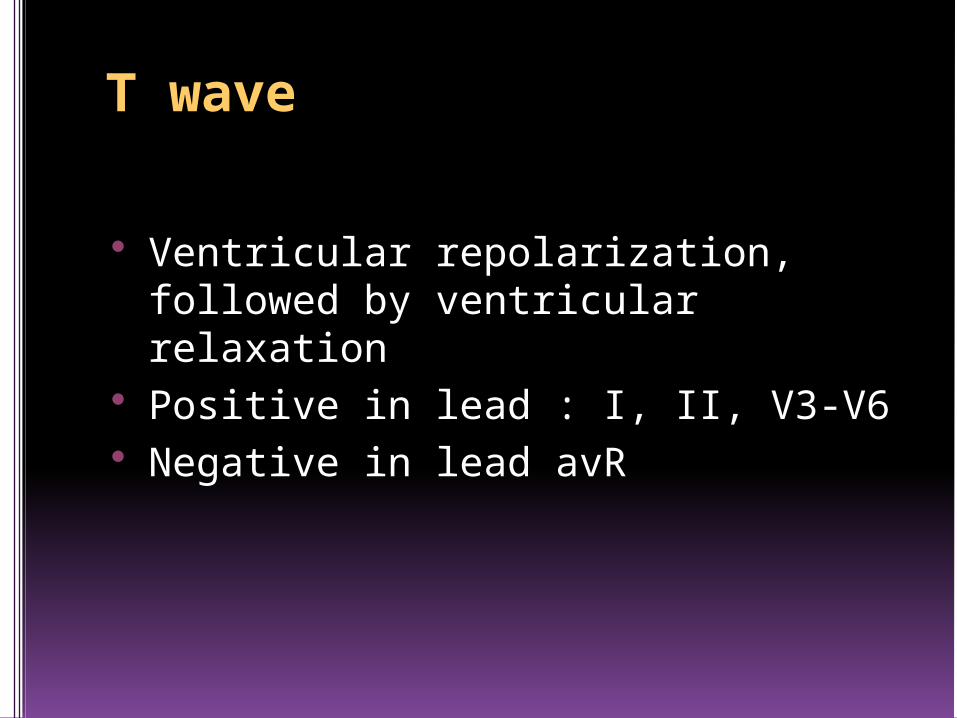
T wave
Ventricular repolarization, followed by ventricular relaxation
Positive in lead : I, II, V3-V6 Negative in lead avR

ECG REPORTING
1. Rhythm
2. QRS rate
3. Axis
4. P wave
5. PR interval
6. QRS complex
7. QRS duration
8. ST segment
9. T wave
10.Extra systoles

Sekian
Terima Kasih
Related Documents